
KOSPI’s Sharp Drop (Plunge) to 5,640 at a Glance
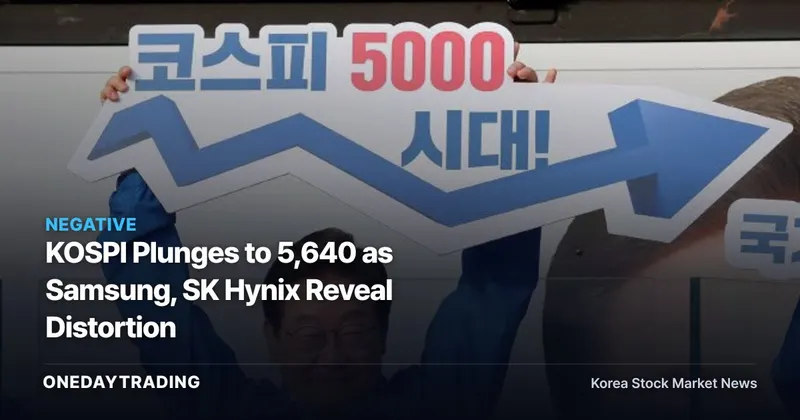
The KOSPI’s intraday decline of more than 3% to the 5,640 level exposed fragile market breadth, rather than merely marking a routine index correction. According to financial industry and Korea Exchange (KRX) data cited by New Daily on November 3, many of the largest stocks by market capitalization remained near or below their May 2025 levels. The real implication is that even as the index rises, investors cannot assume the gains have spread across the broader market.
Why the Declines in Samsung Electronics and SK Hynix Matter
Samsung Electronics fell 4.37% intraday, while SK Hynix dropped 5.03%. As both stocks retreated, the KOSPI also fell more than 3% intraday to touch the 5,640 level. The fact that these stocks and the index weakened together suggests the market may have been relying heavily on a handful of large-cap names.
Because the index is weighted by market capitalization, gains in large-cap stocks can mask weakness elsewhere. Conversely, when the stocks supporting the index also decline, previously hidden weakness in market breadth comes to the surface. If the two semiconductor stocks continue to fall, the gap between index performance and individual investors’ actual returns could become even more pronounced.
What About 37 and 51 Stocks Reveal About Market Breadth
According to New Daily, about 37 of the KOSPI’s 100 largest stocks by market capitalization were trading near or below their May 2025 levels. Among stocks ranked 101st through 200th, about 51 had returned to prices seen during the same comparison period. This is why investors need to examine how many stocks are participating in a rally, rather than focusing on the index level alone.
Small- and mid-cap stocks outside the top 400 by market capitalization were reported to be 30–50% below their May 2025 levels. Before concluding that gains have spread from large semiconductor companies to small- and mid-cap stocks, investors need to see losses in this segment narrow. Even if the index recovers, continued weakness among the groups of about 37 and 51 stocks would provide little evidence that market breadth has improved.
Current Stock Prices Versus May 2025 Levels
- Internet and platforms: NAVER was quoted at 172,300 won, Kakao at 29,225 won, and Kakao Pay at 33,200 won. Regardless of index movements, whether these stocks recover from their May 2025 comparison levels will be an important indicator of whether gains are broadening across the market.
- Gaming and consumer: Krafton was quoted at 181,600 won and Amorepacific at 128,900 won. Prices among non-semiconductor stocks also need to recover before an index rally can be interpreted as a broader market shift.
- Energy and materials: Hanwha Solutions was quoted at 22,950 won, LG Energy Solution at 349,000 won, POSCO Holdings at 266,500 won, and LG Chem at 238,000 won.
- Automobiles and nonferrous metals: Kia was quoted at 93,800 won, Hyundai Mobis at 348,500 won, and Korea Zinc at 863,000 won. A simultaneous recovery across different stock groups would indicate that index concentration is easing.
Overseas Tech Selloff and the Parallel Decline in Korean Semiconductors
In overnight New York trading, Oracle fell 8.6%, Marvell Technology dropped 13.0%, and Intel declined 8.8%. Samsung Electronics and SK Hynix then fell together intraday, making it difficult to view Korean semiconductor stocks in isolation as a reliable backstop for the index.
However, the available data are insufficient to calculate the precise causal relationship or sensitivity between overseas technology stocks and Korean semiconductor companies. What can be confirmed is that stocks in both markets fell in succession and that the KOSPI slid to the 5,640 level intraday. Exact net-selling amounts for foreign investors and institutional investors were not provided.
Three Distinctions Investors Need to Make
- Index level versus market breadth: Investors should look beyond the KOSPI level and monitor whether the roughly 37 stocks in the top 100 and the roughly 51 stocks ranked 101st through 200th recover above their May 2025 comparison prices.
- Semiconductors versus non-semiconductors: A rebound in Samsung Electronics and SK Hynix alone would not prove that gains are broadening. The assessment would carry more weight if price trends in NAVER, Kakao, materials, and automotive stocks also turned higher.
- A one-day decline versus structural weakness: Intraday figures can change. Because the article’s exact publication time and the reference times for each stock price were not provided, the prices should not be compared as though they were closing prices recorded at the same time.
Signals to Watch Before a KOSPI Rebound
In an optimistic scenario, the KOSPI would rebound while stocks that had returned to May 2025 levels also recovered. That would strengthen the case that index gains were broadening beyond a handful of large-cap stocks. Conversely, if only Samsung Electronics and SK Hynix recover while the roughly 37 and 51 stocks remain weak, the index distortion will persist.
The next indicator to watch is not a new index target. Investors should first determine whether the declines in the two semiconductor stocks are stabilizing, whether fewer leading stocks remain at or below May 2025 levels, and whether the 30–50% losses among small- and mid-cap stocks outside the top 400 by market capitalization are being recouped. Market breadth needs to improve before the index does to support the view that this sharp drop (plunge) marks the beginning of a structural shift.
KOSPI MetricsAs of 2026-11-03
| Performance by Period | 1 Week +0.19% 1 Month -18.97% |
|---|
Index, commodity, and exchange rate figures are based on global markets and reflect values at the time of publication.
Samsung Electronics Key MetricsAs of 2026-11-03
| Returns by Period | 1 Week -1.13% 1 Month -20.47% |
|---|---|
| Trading Value · Trading Volume | 27.3 billion won · 18,732,752 shares |
| Supply-Demand (Order Flow) | Foreign Investors Net selling of 206.8 billion won Institutional Investors Net selling of 38.9 billion won |
| Recent News Tone | 5 positive catalysts · 3 negative catalysts |
Price and supply-demand (order flow) data are real-time figures from Korea Investment & Securities (KIS), while supply-demand (order flow) and news-tone figures are calculated independently by One Day Trading.
Upcoming Events to Watch
- 11.12Index Options ExpirationLowKOSPI 200 options expiration
- 11.26Bank of Korea Monetary Policy Board MeetingHighBenchmark interest rate decision meeting
- 12.09FOMC Policy Rate DecisionHighFederal Reserve monetary policy announcement — direction of interest rates and the dollar
- 12.10Futures and Options ExpirationMediumQuadruple witching — watch for volatility and supply-demand (order flow) disruptions
This article was automatically summarized and analyzed from the original news report. View the original article (New Daily)