
Summary
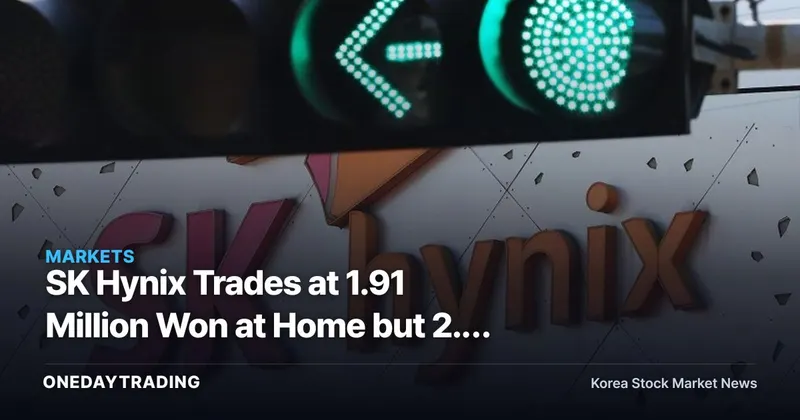
The moment SK Hynix was trading at 1.91 million won on the domestic exchange, the same stock was trading at the equivalent of roughly 2.9 million won overseas. This gap emerged as semiconductor stocks plunged this month, dragging down the broader KOSPI. Big-data indicators showing SK Hynix sweeping the No. 1 spot in portal stock searches and the top four spots in related brokerage reports suggest this price gap isn't a one-off distortion, but the result of structurally concentrated demand.
How It Unfolded
The starting point is that Samsung Electronics and SK Hynix, the two sector bellwethers, led this month's sharp drop in the semiconductor industry sector. Yet over the same period, domestic investor attention became even more concentrated on SK Hynix alone. In wealth-management big-data rankings, SK Hynix ranked No. 1 in search volume, and reports on the company filled the top four spots in brokerage report popularity rankings. It's a seemingly contradictory pattern — the stock price fell, yet interest surged.
Layered on top of this is the gap between the 1.91-million-won domestic price and the 2.9-million-won overseas price. For the same equity stake, the overseas-converted price is running more than 50% above the domestic closing price. SK Hynix has no officially listed ADR on the New York Stock Exchange. For overseas investors to take a position in this stock, they must go through informal OTC channels or limited-liquidity venues, and a premium gets tacked on in the process. In other words, this premium looks less like an earnings surprise and more like a liquidity premium created by limited access.
Structural Background
That said, the liquidity premium alone doesn't fully explain it. The key point is that the premium isn't attaching to just any semiconductor stock (ticker) — it's narrowly concentrated on SK Hynix. The fact that SK Hynix is effectively the dominant supplier of HBM for AI servers is what allows its share price and overseas demand to move independently, even as the commodity DRAM and NAND price cycle wobbles. Samsung Electronics also plunged this month, but a comparable overseas premium hasn't been confirmed for it — and that's precisely because the two companies differ in their HBM revenue mix and in how far along their customer certification processes are.
Ripple Effects on Stocks and the Sector
- SK Hynix: The party at the center of both the overseas premium and the search-volume concentration. The key question to watch is whether its HBM supply position can sustain the demand base independent of the short-term price plunge.
- Samsung Electronics: The comparison case in this same sell-off. The wider the gap in HBM certification progress and revenue mix, the larger the valuation divergence between the two stocks (tickers) could become.
- Hanmi Semiconductor: A supplier of bonding equipment used in HBM packaging processes to SK Hynix — a downstream stock (ticker) in the value chain whose earnings are tied to the flow of orders from SK Hynix.
Bullish vs. Bearish Scenarios
The bullish scenario runs as follows: the plunge is just a short-term supply-demand (order flow) adjustment, and the No. 1 search ranking, the concentration of brokerage reports, and the overseas premium can all be read as leading signals that HBM-driven demand hasn't broken down. Under this view, the pullback could be reinterpreted as a buying opportunity.
The bearish scenario, by contrast, holds that the premium itself is nothing more than a distorted indicator. Shallow liquidity in OTC channels means prices can jump on just a handful of trades, and a No. 1 search ranking is a routine phenomenon that tends to appear whenever a stock plunges, regardless of fundamentals. Reading too much into it as a fundamental signal could lead to a misjudgment.
Action Points for Investors
- Check the HBM revenue mix and shipment growth rate directly in next quarter's earnings release.
- Watch for disclosures or reports on additional HBM orders and certifications from customers such as Nvidia.
- Track whether the domestic-overseas price gap narrows or widens further over time.
- Use Samsung Electronics' progress on HBM certification as a benchmark for judging the valuation gap with SK Hynix.
SK Hynix by the Numbers: Real-Time Data
SK Hynix's most recent closing price was 1,759,000 won (-8.34% versus the prior session), and the signal combining foreign and institutional investor supply-demand (order flow) with news and momentum reads 🔴 Caution. Foreign investor, institutional investor, and momentum signals are all negative, so caution is warranted right now.
- ▼ Double-sided selling — foreign investors −1.7533 trillion won · institutional investors −867.4 billion won, selling in tandem
- ▼ Trend alignment — short- and medium-term downtrend alignment (today -8.3% · 1 week -4.5% · 1 month -32.9%)
- ▲ News flow — 10 positive catalysts vs. 4 negative catalysts — positive catalysts prevail
Recent related news skews favorable, with 10 positive catalysts versus 4 negative catalysts.
※ Price and foreign/institutional investor supply-demand (order flow) data are provided by Korea Investment & Securities (KIS) and reflect the time of publication.
This article is automatically summarized and analyzed content based on the original news report. View original (Maeil Business Newspaper - Securities)