
KOSPI and KOSDAQ Closing Brief
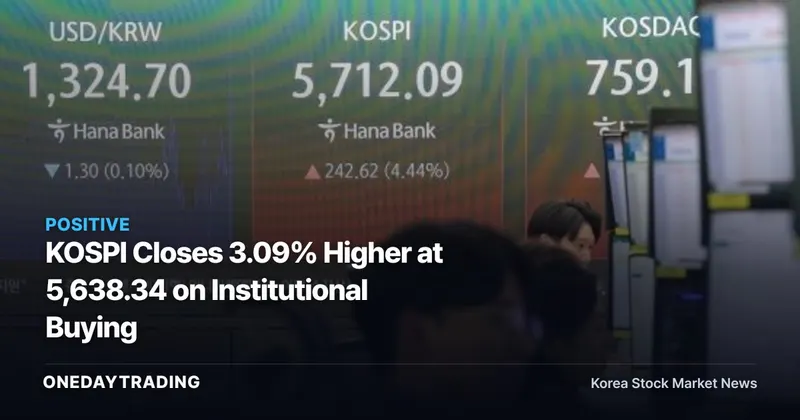
The KOSPI closed at 5,638.34 on October 27, 2026, up 3.09%. The key investment implications of the session, as reported by Asia Business Daily Securities, lie less in the percentage gain itself than in combined net buying by foreign investors and institutional investors, strength in electrical and electronics stocks, and the gap between the intraday high and closing price. This indicates that while a strong buying response was evident, it is too early to conclude that its momentum was fully sustained.
- The KOSPI finished 191.18 points higher at 5,638.34, while the KOSDAQ gained 16.62 points to 743.83.
- In the KOSPI market, foreign investors recorded net purchases of 591.1 billion won and institutional investors 282 billion won, while retail investors sold a net 949.3 billion won.
- A buy-sidecar was triggered, and the KOSPI climbed as high as 5,737.61 intraday before closing at 5,638.34.
What the KOSPI’s 3.09% Gain Signals
A buy-sidecar temporarily suspends the execution of program buy orders. Its activation during the session shows that buying pressure surged rapidly over a short period. At the same time, the KOSPI’s retreat from an intraday high of 5,737.61 to a close of 5,638.34 means the full extent of the intraday advance was not maintained through the close.
The distinction between what has and has not been confirmed is clear. Confirmed developments include simultaneous gains in the KOSPI and KOSDAQ, net buying by foreign investors and institutional investors, and advances across several industry sectors. What the data do not establish is the cause of the index gains or the market’s subsequent direction. Before interpreting a one-day price reaction as a sustained revaluation, investors need to confirm separately whether the same supply-demand (order flow) and industry-sector trends continue.
Foreign and Institutional Buying Versus Retail Selling
Supply-demand (order flow) in the KOSPI market was sharply divided. While retail investors sold a net 949.3 billion won, foreign investors and institutional investors bought a net 591.1 billion won and 282 billion won, respectively. In the KOSDAQ market, retail investors sold a net 165.9 billion won, while foreign investors and institutional investors recorded net purchases of 24.5 billion won and 150.4 billion won, respectively.
The fact that the same investor groups moved in the same direction across both markets is central to interpreting this rebound. However, the reason for the supply-demand (order flow) was not provided. Continued net buying by foreign investors and institutional investors would provide further evidence for the rally’s durability, but if that trend reverses, this session alone would not be enough to confirm a change in market direction.
Electrical, Electronics and Manufacturing Drive the Advance
In the KOSPI, electrical and electronics rose 4.48%, outpacing the index’s 3.09% gain. Medical and precision equipment advanced 4.30%, manufacturing 3.52%, machinery and equipment 2.26%, and financials 2.18%. The available data confirm that the rally was not confined to a handful of stocks, with the major industry sectors listed also advancing.
In the KOSDAQ, nonmetallic materials rose 4.70%, machinery and equipment 4.23%, and electrical and electronics 3.97%. Financials gained 3.93%, while manufacturing advanced 2.82%. Electrical and electronics and manufacturing rose in both the KOSPI and KOSDAQ, but the data provide no basis for attributing those gains to the same cause.
Moves in Samsung Electronics, SK Hynix and Other Stocks
- SK Square was up 7.67% as of 15:27 on October 27, 2026, the largest gain among the major KOSPI stocks provided.
- Samsung Electro-Mechanics was up 7.42% at the same time, while SK Hynix gained 5.18%.
- Samsung Electronics rose 4.23%, while Samsung Electronics Preferred advanced 4.20%.
- Ecopro was up 6.74% at the same time, Ecopro BM 5.58%, Jusung Engineering 4.30%, and Rainbow Robotics 1.15%.
It is important to distinguish between the reference points used for the index and individual stock figures. The KOSPI and KOSDAQ figures are closing prices, while the individual stocks’ price change rates are as of 15:27. These figures therefore should not be interpreted as the stocks’ final price movements for the session.
Risks to Watch After the Rebound
- A gap remained between the KOSPI’s intraday high of 5,737.61 and its closing price of 5,638.34. Investors should also consider that the strength of intraday buying was not sustained through the close.
- Because the cause of the advance has not been confirmed, the factors behind net buying by foreign investors and institutional investors cannot be identified.
- The individual stocks’ price change rates are as of 15:27, so their final prices cannot be confirmed from the data provided.
- A single day of industry-sector gains provides no basis for judging changes in corporate earnings or valuations.
What to Monitor in the Next Session
The sequence of checks is straightforward. Before focusing on the direction of the KOSPI and KOSDAQ, investors should watch whether supply-demand (order flow) from foreign investors and institutional investors holds, whether gains in electrical and electronics and manufacturing continue, and whether advances repeatedly fade after intraday highs. This rebound was clearly strong, but the next set of data needed to demonstrate its durability is not yet available.
Bottom Line
The concurrent gains that took the KOSPI to 5,638.34 and the KOSDAQ to 743.83 were a positive response supported by net buying from foreign investors and institutional investors and broadening gains across industry sectors. However, given the gap between the intraday high and closing price and the unconfirmed cause of the advance, the case for optimism will become more compelling only if the next supply-demand (order flow) and industry-sector trends hold.
KOSPI Index MetricsAs of 2026-10-27
| Performance by Period | 1 Week +1.54% 1 Month -19.66% |
|---|
Index, commodity and exchange rate figures are based on global markets and reflect values at the time of publication.
Samsung Electronics Key MetricsAs of 2026-10-27
| Returns by Period | 1 Week +4.49% 1 Month -20.07% |
|---|---|
| Trading Value · Trading Volume | 39 billion won · 20,281,115 shares |
| Supply-Demand (Order Flow) | Foreign Investors +219.9 billion won net buying Institutional Investors +89.3 billion won net buying |
| Recent News Tone | Positive Catalyst 8 · Negative Catalyst 2 |
Price and supply-demand (order flow) data are real-time figures from Korea Investment & Securities (KIS), while supply-demand (order flow) and news-tone tallies are calculated independently by OneDay Trading.
Upcoming Events to Monitor
- 10.28FOMC Policy Rate DecisionHighU.S. Federal Reserve monetary policy announcement — direction of interest rates and the dollar
- 11.12Index Options ExpirationLowKOSPI 200 options expiration
- 11.26Bank of Korea Monetary Policy BoardHighBenchmark interest rate decision meeting
- 12.09FOMC Policy Rate DecisionHighU.S. Federal Reserve monetary policy announcement — direction of interest rates and the dollar
This article was automatically summarized and analyzed from the original news report. View the original article (Asia Business Daily Securities)