
What Hyundai and Kia’s Rising U.S. Market Share Signals
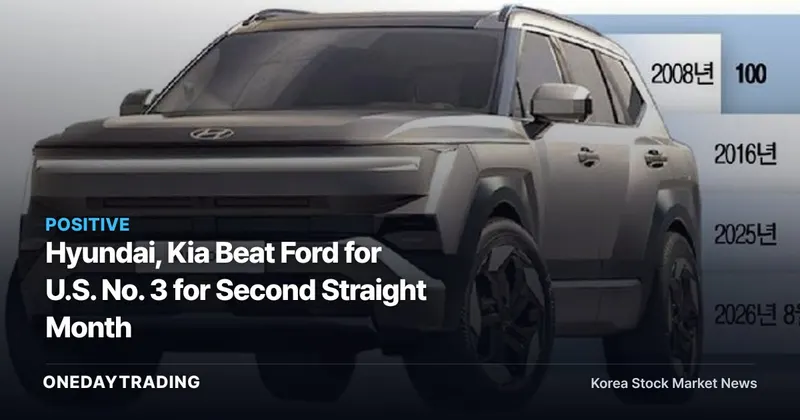
Hyundai and Kia surpassed Ford in monthly U.S. sales market share for the second consecutive month. For investors, the key takeaway from figures reported by Maeil Business Newspaper is more than a simple change in rankings. Tucson’s long-term sales base is translating into greater U.S. market share for Hyundai Motor Group. This also distinguishes a one-off sales record from sustainable competitiveness.
Monthly U.S. sales market share represents each automaker’s share of total vehicle sales in the U.S. market over a given period. Hyundai and Kia were counted together as members of Hyundai Motor Group and moved ahead of Ford into third place beginning in July. Monthly rankings do not guarantee annual standings, but maintaining the position carries more significance than a one-month fluctuation.
Tucson’s 10.61 Million Sales Build a Global Foundation
From its launch through August this year, Hyundai Motor’s Tucson sold a cumulative 10.61 million units globally, excluding China-exclusive models. Overseas markets accounted for 91% of cumulative sales. This indicates that Tucson is not a model reliant on domestic demand, but one that has achieved scale through an international sales network and production footprint.
In the United States, 2,227,154 Tucson vehicles were sold from launch through August this year. The U.S. has clearly been a core market supporting the model’s long-term sales. A Hyundai Motor representative said, “Tucson’s sustained success reflects the results of our strategy to establish local production and sales operations in major markets.”
How Hyundai Motor Group Widened Its Lead Over Ford
Hyundai and Kia sold 165,284 vehicles in the U.S. in July, up 5.0% year over year, for a market share of 12.1%. In the same month, General Motors (GM) held 16.7%, Toyota 15.9%, and Ford 12.0%. Hyundai Motor Group led Ford by just 0.1 percentage point, making it difficult to conclude that the ranking was secure.
In August, Hyundai and Kia’s U.S. market share rose to a monthly record of 12.9%. Their lead over Ford also widened to 1.0 percentage point. What matters to the market is not merely that they overtook Ford once, but that both their market share and lead expanded the following month.
How This Could Affect Hyundai Motor and Kia Shares
- Hyundai Motor: Tucson’s cumulative sales of 10.61 million units and 91% overseas share demonstrate the breadth of its global sales base. If U.S. market share holds, the case for sustained sales of its core models in a key overseas market will strengthen.
- Kia: U.S. market share was calculated for Hyundai and Kia combined at the Hyundai Motor Group level. The rise in the monthly ranking is therefore a sales indicator directly relevant to Kia, but the provided data do not allow each company’s contribution to be separated.
- Automotive industry sector: Higher sales and market share are positive for assessments of overall business scale. However, without data on vehicle pricing, costs, and sales mix, it would be premature to infer improved profitability from these figures alone.
Counterpressure From Chinese Automakers’ Overseas Capacity
The next stage of competition is likely to be determined more by overseas production infrastructure than by export volumes. According to the International Energy Agency (IEA), Chinese automakers had approximately 1.7 million units of overseas production capacity as of 2025. As their manufacturing footprint expands, they will compete more broadly with Hyundai Motor Group’s established local production and sales base.
This is where the bullish outlook reaches its limits. Tucson’s cumulative sales record demonstrates long-term competitiveness, but past sales volumes alone do not guarantee future market share. If Chinese automakers convert their overseas production capacity into actual sales growth, competitive pressure on pricing and supply could intensify.
Indicators Investors Should Watch Next
- Monthly U.S. market share: The first point to monitor is whether Hyundai and Kia can maintain August’s 12.9% level and their lead over Ford.
- Lead over Ford: Investors should watch whether the gap, which widened from 0.1 percentage point in July to 1.0 percentage point in August, holds.
- Annual ranking: Ranking third for two consecutive months is not the same as finishing third for the full year. Investors should monitor the consistency of monthly figures until the annual result is confirmed.
- Cumulative Tucson sales: The exact timing of the next milestone in global cumulative sales has not been confirmed. Future sales data released by Hyundai Motor will provide the basis for assessment.
What It Takes to Turn a Monthly No. 3 Ranking Into Lasting Strength
In the positive scenario, Tucson’s overseas sales base remains strong while Hyundai and Kia continue gaining U.S. market share. Two consecutive months in third place would then become more than a temporary ranking change, supporting a reassessment of their competitiveness in the local market. Maintaining the lead over Ford would further increase confidence in the monthly performance.
Conversely, the interpretation would change if U.S. market share declines. Tucson’s cumulative sales record would remain, but it would carry less weight as evidence of current sales competitiveness. The focus now is not the size of the record, but its repeatability. The next U.S. sales release should be assessed for whether market share, the lead over Ford, and Hyundai and Kia’s sales trends continue moving in the same direction.
Key Hyundai Motor MetricsAs of 2026-10-01
| Period Returns | 1 Week -3.48% 1 Month -13.27% |
|---|---|
| Trading Value · Trading Volume | 4.8 billion won · 723,753 shares |
| Supply-Demand (Order Flow) | Foreign Investors Net selling of 39.1 billion won (7 consecutive days) Institutional Investors Net selling of 3.6 billion won |
| Recent News Tone | 1 Positive Catalyst · 2 Negative Catalysts |
Real-time price and supply-demand (order flow) data are provided by Korea Investment & Securities (KIS), while supply-demand (order flow) and news-tone figures are calculated independently by OneDayTrading.
Supply-Demand (Order Flow) and Momentum Assessment🔴 Caution
Foreign investor, institutional investor, news, and momentum indicators are showing negative signals.
- ▼Supply-Demand (Order Flow) ContinuityForeign investors were net sellers for 7 consecutive days (39.1 billion won)
- ▼Joint SellingForeign investors sold 39.1 billion won and institutional investors sold 3.6 billion won
- ▼Trend AlignmentShort- and medium-term downside alignment (day -1.0% · 1 week -3.5% · 1 month -13.3%)
- ▼News Flow1 positive catalyst vs. 2 negative catalysts — negative catalysts prevail
Upcoming Events to Watch
- 10.08Index Options ExpirationLowKOSPI 200 options expiration
- 10.22Bank of Korea Monetary Policy Board MeetingHighBenchmark interest rate decision meeting
- 10.28FOMC Policy Rate DecisionHighU.S. Federal Reserve monetary policy announcement — direction of interest rates and the dollar
- 11.12Index Options ExpirationLowKOSPI 200 options expiration
This article was automatically summarized and analyzed based on the original news report. View original article (Maeil Business Newspaper—Companies)