
3-line briefing
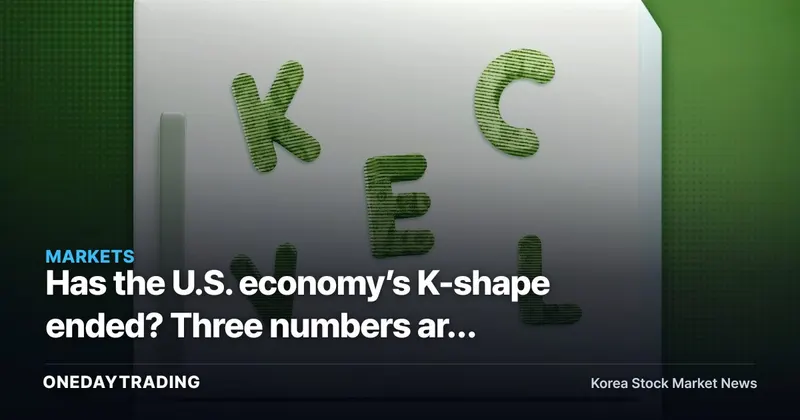
The K-shaped debate in the U.S. economy is not over; it means consumption is moving separately by income group rather than as a single average. That divide leads to very different earnings interpretations for Visa and Mastercard, Walmart and Costco, and Target and Hilton.
- U.S. Treasury Secretary Scott Bessent and some companies are talking about a shift to C-shaped, but the data has not yet settled in one direction.
- August University of Michigan consumer sentiment of 51.7 and $1.26 trillion in credit card debt show that pressure remains at the bottom.
- The market has already priced in slower averages. What it has not fully priced in yet is the gap between customer tiers.
What changes
The K-shaped debate in the U.S. economy is not just a buzzword. K-shaped means spending by high-income and low-income households diverges in opposite directions, while C-shaped describes a phase in which the lower end starts catching up. E-shaped is a picture in which the middle class also moves separately, splitting into three tracks.
The point of this debate is not a fight over labels. Secretary Bessent said K-shaped is over, citing lower-income wage gains and tax cuts, while Hilton management said the middle and upper-middle ranges have moved from negative to as much as 6% growth. But consumer sentiment and debt remain cautious. If oil prices keep rising, perceived inflation for lower-income households will be hit first, and the C-shaped bullish case will again be pushed aside by the K-shaped reality view.
The market has already priced in a slowdown in the economic average. But the difference in spending by income group has not been fully reflected. Even within U.S. consumption, payment networks, discount retail, mid-priced travel, and durable goods are producing different numbers.
Reading the numbers in context
August University of Michigan consumer sentiment fell to 51.7 from 55.2 in July, down 11% from a year earlier. Household credit card debt in the second quarter climbed back to $1.26 trillion, near a record high again. In a May 2026 data release, the New York Fed said the consumption gap is being driven mainly by high-income households, and an Atlanta Fed study also found that from 2021 to 2025, spending growth among high-income households was faster than among lower-income households.
These figures then filter through interest rates and valuations to reshape industry sector leaders. When rates are high, interest burdens hit the lower end of households first, and then mid-priced consumption follows. Conversely, even if rates come down, if cash flow by income group does not improve, only the average indicators get better and stocks move selectively.
Winners and losers
- Visa and Mastercard: they benefit first if transaction volumes hold up. Even in a polarized consumer environment, payment networks are more sensitive to total volume than to the average.
- Walmart and Costco: they are defensive when lower-income households and value-seeking demand increase. Even in the same slowdown, they can gain share.
- Target and Home Depot: they are more sensitive to middle-income spending and housing-related outlays. If the move to C-shaped remains weak, recovery will be slow.
- Hilton Worldwide and Expedia: momentum improves only if mid- and upper-middle travel demand rebounds. This is a segment where middle-class recovery needs to show up in the numbers.
- Colgate-Palmolive: staples tend to gain relative strength the longer weakness at the lower end persists. However, pricing power may soften.
Risk check
- If oil prices keep rising, perceived inflation for lower-income households jumps again. The C-shaped narrative quickly weakens.
- If credit card delinquency rates rise further, even the last support for consumption resilience starts to break.
- If consumer sentiment slips further below 50, only discount retailers and consumer staples remain, and mid-income leisure stocks see their multiples wobble first.
- If optimistic policy comments get ahead of actual spending, the market will reverse course once again.
Bottom line in one line
The U.S. economy has not cleanly switched from K-shaped to C-shaped; it is in a transition phase in which the top is holding up and the bottom is catching up. Korean investors should look first at customer-tier revenue and credit indicators rather than average GDP.
Frequently asked questions
Has the U.S. economy really shifted from K-shaped to C-shaped?
It is still too early to say. Some policy measures and wage gains have lifted the lower end, but consumer sentiment and credit card debt are still sending pressure signals.
In other words, for a C-shaped transition to be confirmed, actual spending by low- and middle-income households and delinquency indicators need to improve together. Right now, it is less a matter of a new label and more a stage where the data is pointing in different directions.
Why does this debate matter for U.S. consumer stocks?
Even within U.S. consumption, earnings sensitivity is completely different depending on the customer base. Payment stocks and discount retail tend to hold up better, while mid-priced apparel, appliances, and leisure feel income-pressure sooner.
That is why the market looks at mix, not just average revenue. Who is spending, where they are spending, and at what price point is what separates stocks.
What should Korean investors watch first?
After August, the first things to watch are consumer sentiment, credit card delinquency rates, oil prices, and the next Fed comments. If those four turn down together, the case for a consumer recovery loses force.
On the other hand, if lower-income consumption and middle-class travel indicators improve together, the interpretation of discount retail, travel, and payment stocks changes. At that point, customer tier matters more than the industry sector as a whole.
Reference materials: https://www.newyorkfed.org/research/economic-heterogeneity-indicators, https://www.atlantafed.org/research-and-data/publications/policy-hub-papers/2026/05/18/03-k-shaped-economy-or-not-evidence-from-payments-survey, https://www.federalreserve.gov/monetarypolicy/2026-07-mpr-part1.htm, https://www.minneapolisfed.org/article/2026/have-us-consumers-gone-k-shaped-a-review-of-the-data, https://fortune.com/2026/08/05/scott-bessent-is-sick-of-hearing-about-the-k-shaped-economy-and-declares-its-overbut-the-data-would-beg-to-disagree/
S&P 500 indicatorAs of 2026-08-30
| Period trend | 1 week +0.92% 1 month +5.41% |
|---|
Indices, commodities, and exchange rate are based on global market benchmarks and are values at the time of publication.
This article is automatically summarized and analyzed based on the original news. View original article (CNBC)