
What Michael Burry’s Warning Means
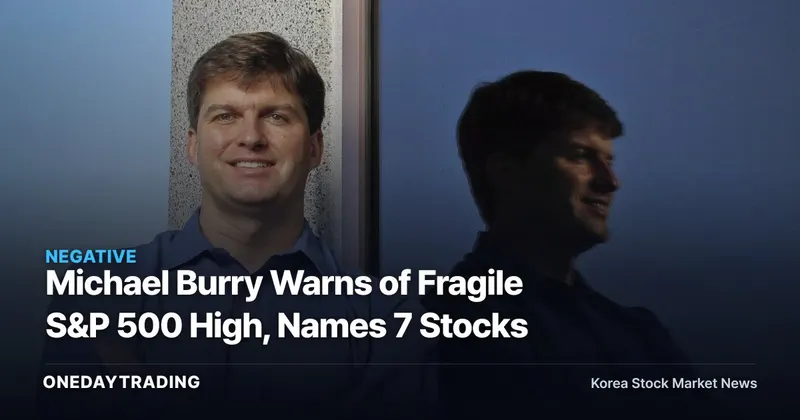
Michael Burry characterized the S&P500’s record high on October 6, 2026, as fragile and identified seven stocks that had already fallen sharply as potential investments. The argument, reported by Maeil Business Newspaper’s securities desk on the 26th, is more than a simple proposal to buy the dip. It reflects a contrarian view: if few stocks are participating even as the index rises, stocks that have already collapsed may offer better relative opportunities than richly valued market leaders when the market changes direction.
Market breadth indicates how many stocks are participating in an index’s advance. In other words, investors should examine the distribution of stocks within the market rather than focusing solely on the index. What is currently known is that the index reached a record high on narrow participation. What remains unknown is the S&P500’s future direction and the prospective returns of the stocks Burry identified.
Narrow Participation Behind the S&P500’s 7818.93 Record
The S&P500 analyzed by Michael Burry reached a record closing price of 7818.93 on October 6, but only 15 stocks set new highs that day, while just 97 were trading within 10% of their 10-year highs. He described this as “fragile leadership.” These figures show that the concern was not the index’s level, but the small number of stocks supporting its advance.
Burry noted that the S&P500 has set 982 record closing prices since 1982. His point is that record highs themselves are not rare. The problem arises when investors treat a rising index and broad participation as the same thing. As participation narrows, the index becomes more sensitive to a handful of leading stocks, and the equation changes if their momentum reverses.
What the Dot-Com Bubble Comparison Says About Rotation
Michael Burry divided stocks into market leaders trading within 10% of their 10-year highs, trend-breakers down 20~40% from their highs, and crash stocks down more than 40%. This framework does not equate a stock’s price position with the quality of its underlying company; instead, it examines how each group might perform differently when the market changes direction.
Eighteen months after March 24, 2000, the median market leader had fallen 50%. By contrast, trend-breakers gained 8%, while crash stocks rose 18%. Historical comparisons do not guarantee that the same pattern will recur today. The recent crash-stock group has a median price-to-earnings ratio of 17.2 times, above the 10.2 times recorded in 2000, making it difficult to conclude that these stocks are cheap based on their declines alone.
From Lululemon to AppLovin, the Declines Are Not Equal
The stocks Burry discussed were Lululemon, PayPal, Fiserv, Deckers Outdoor, Zoetis, Adobe and AppLovin. The seven stocks have fallen about 31% on average year to date, with AppLovin down 58%. He stressed that not every crash stock is attractive and that investors must also examine earnings and the business outlook.
- AppLovin: Its 58% year-to-date decline was the largest among the seven stocks. Burry assessed it as having the highest return on invested capital in the comparison group, but whether he actually owns the stock and the size of any position have not been confirmed.
- Lululemon, PayPal, Fiserv, Deckers Outdoor, Zoetis and Adobe: A steep decline alone is not a reason to buy. Burry’s screening criteria require each company to pass tests covering shareholder earnings, return on invested capital, valuation and its business outlook.
- S&P500 market leaders: If market breadth recovers, the fragile-high thesis will weaken. If participation continues to narrow, the index’s dependence on a small number of stocks will be tested first.
Two Paths Separating the Bull and Bear Cases
In the bullish scenario, a change in market direction allows stocks that have already fallen sharply to regain a relative advantage. If the seven companies maintain their earnings and business outlooks while valuation pressure eases, their declines could become the starting point for a rerating rather than merely a sign of weakness.
In the bearish scenario, the earnings or business outlooks of the crash stocks justify their price declines. The recent group’s median price-to-earnings ratio of 17.2 times also provides a weaker margin of safety. Stocks that have already declined do not automatically become defensive holdings when the index falls, and the contrarian thesis breaks down if they fail the screening criteria.
Substack Price Reversal Shows Another Burry Decision
Michael Burry withdrew a planned Substack subscription price increase that was due to take effect on November 1. He had planned to raise the monthly fee from $49, or about 65,000 won, to $69, or about 91,000 won, and the annual fee from $479, or about 630,000 won, to $679, or about 900,000 won. He instead retained the existing prices, citing “accessibility and continuity.”
Burry’s Substack currently has 402,000 followers and 343,000 paid and free subscribers combined. At launch, subscriptions cost $39 per month or $379 per year. The withdrawal of the price increase is separate from the validity of his investment thesis, and the available information does not specify the scale of the backlash or the detailed circumstances behind the decision.
What Korean Investors Should Check, in Order
- S&P500 market breadth: Watch whether the numbers of stocks making new highs or trading near their highs increase. A recovery in participation would weaken the case that market leadership is fragile.
- The seven companies’ next earnings: Whether earnings and business outlooks remain intact matters more than the scale of their share-price declines. If the numbers weaken, the market will have confirmed the reason for the declines rather than identified undervaluation.
- Valuation: Investors should bear in mind the gap between the recent crash-stock group’s median price-to-earnings ratio of 17.2 times and the 10.2 times recorded in 2000. There is insufficient basis for applying historical returns directly to today’s market.
- Distinguishing discussion from ownership: The available information confirms only that Burry discussed the stocks as potential investments. Whether Michael Burry actually owns them and the size of any positions remain unconfirmed.
S&P 500 IndicatorsAs of 2026-10-26
| Performance | 1 Week -0.47% 1 Month -1.04% |
|---|
Index, commodity and exchange rate figures are based on global markets and reflect values at the time of publication.
This article was automatically summarized and analyzed based on the original news report. View the original article (Maeil Business Newspaper Securities)