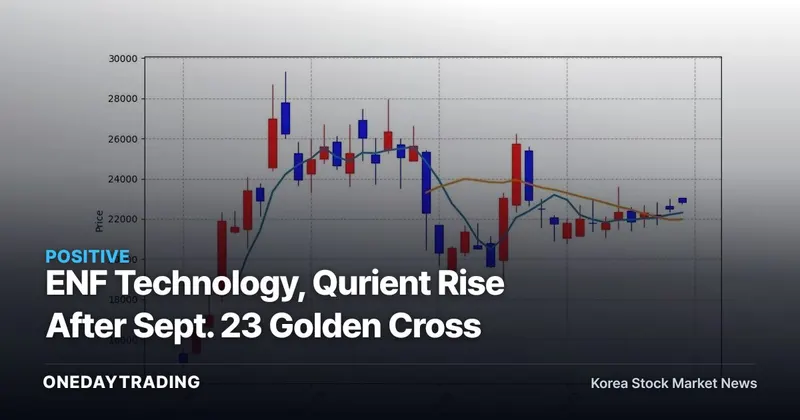

What the Golden Cross Means for ENF Technology and Qurient
The golden crosses seen in ENF Technology and Qurient are price signals indicating strengthening trends, not evidence that their corporate values improved at the same time. Maeil Business Newspaper’s securities desk reported, based on MK Signal analysis, that both companies’ five-day moving averages crossed above their 20-day moving averages on September 23. Investors should first distinguish the confirmed share-price response from earnings and corporate-value information that has yet to be disclosed.
A golden cross occurs when a shorter-term average price rises above a longer-term average. The signal speaks only to the price trend. The available information is insufficient to determine either the cause of the gains or subsequent trading performance.
ENF Technology: The Price Signal Reflected at 46,000 Won
Following the golden cross, ENF Technology closed at 46,000 won, up 5.38% from the previous closing price. As of 09:13, it was trading at 46,150 won, 0.33% above the previous close. What this actually confirms is that the stock rose after the technical signal—not that earnings from its semiconductor and display materials business have improved.
The company manufactures and sells process chemicals for semiconductors and displays and operates plants in Ulsan, Asan, and Cheonan. Its subsidiaries include investment entities in China and the United States, along with UB Materials and FEM Technology. Extending the price signal into a business assessment would therefore require earnings data from its core operations and subsidiaries, but no such figures are included in the information provided.
Qurient: The Gap Between the Rise to 22,500 Won and Its Pipeline
Following the same golden cross, Qurient closed at 22,500 won, up 2.04% from the previous closing price. As of 09:13, it was trading at 22,850 won, 1.56% above the previous close. The confirmed fact is the share-price movement; no evidence was presented linking that change to progress in pharmaceutical research and development.
Qurient is developing mocaciclib, QP101, and an Axl/Mer/CSF1R triple-inhibitor anticancer drug as its principal pipeline assets. It also has strategic partnerships with France’s Institut Pasteur and Germany’s Max Planck Institute, as well as priority review rights for basic research projects in oncology and autoimmune diseases. When assessing a biotech company, a crossover in price averages and progress in research and development represent different forms of evidence, so one should not be treated as proof of the other.
Why Semiconductor Materials and Biotech Cannot Be Judged by the Same Yardstick
The only common denominator between the two companies is the technical signal that occurred on September 23. ENF Technology’s business is built on manufacturing, sales, and plant operations, while Qurient focuses on pharmaceutical research and development and its pipeline. Even with the same golden cross, the business evidence that must subsequently be verified is inherently different.
An easily overlooked point is that the difference in share-price gains does not necessarily represent a difference in corporate value. Because the data provide no information on the two stocks’ earnings, corporate values, or reasons for the price movements, there is also no basis for interpreting the 5.38% and 2.04% gains as a ranking of business performance. The figures show only how each stock reacted relative to its previous closing price.
Stock-Specific Transmission Channels
- ENF Technology: Both its business identity as a manufacturer and seller of semiconductor and display process chemicals and its post-golden-cross gain were confirmed. However, the mere operation of plants in Ulsan, Asan, and Cheonan or ownership of subsidiaries is insufficient to determine the direction of revenue and profit.
- Qurient: The pharmaceutical R&D company’s price signal strengthened, but this does not mean that development progress has been confirmed for mocaciclib, QP101, or its Axl/Mer/CSF1R triple-inhibitor anticancer drug. Pipeline information and share-price reactions should be tracked separately.
Conditions for Continued Strength or a Bearish Reversal
A bullish interpretation would gain support if the two companies’ price trends continue. Even then, the golden cross would remain only a starting point for monitoring the trend and would not substitute for evidence of ENF Technology’s business performance or Qurient’s R&D progress. The fact that MK Signal provides investment information and trading signals for some 8,000 Korean and U.S. stocks also does not guarantee the future performance of any individual signal.
Conversely, if the price trends reverse, the bullish case built on the golden crosses would be the first to weaken. A more fundamental bearish condition would be the failure of the companies’ next business updates to support the expectations reflected in their prices. Because price movements after the quoted current prices have not been verified, it is also too early to present target prices or projected returns.
What Investors Should Check Next
- Price: Track separately whether the technical uptrends continue after ENF Technology’s 46,150 won and Qurient’s 22,850 won levels.
- Business: Check ENF Technology’s next earnings release to determine whether its process-chemical manufacturing and sales and plant operations translate into actual earnings.
- Research and development: Monitor Qurient for newly disclosed development data on each major pipeline asset. Do not infer research results solely from a crossover in price averages.
- Analytical boundary: Price movements after the quoted current prices and the corporate values of both companies fall outside the scope of the information verified here. Until new data emerge, it is more accurate to treat the golden crosses as monitoring signals rather than evidence of trading performance.
ENF Technology Key MetricsAs of 2026-09-28
| Period return | 1 week +13.54% 1 month +3.87% |
|---|---|
| Trading value · Trading volume | 39,997 shares |
| Supply-demand (order flow) | Foreign investors Net purchases of 75.78 million Institutional investors No significant trading |
Price and supply-demand (order flow) data are real-time figures from Korea Investment & Securities (KIS), while supply-demand (order flow) and news-tone aggregates are calculated independently by One Day Trading.
Supply-Demand (Order Flow) and Momentum Assessment🟢 Buying Dominates
Foreign-investor and momentum indicators are showing positive signals.
- ▲Trend alignmentShort- and medium-term bullish alignment (today +2.1% · 1 week +13.5% · 1 month +3.9%)
Upcoming Dates to Watch
- 10.08Index Options ExpirationLowKOSPI 200 options expiration
- 10.22Bank of Korea Monetary Policy BoardHighBenchmark interest rate decision meeting
- 10.28FOMC Policy Rate DecisionHighU.S. Federal Reserve monetary policy announcement — direction of interest rates and the dollar
- 11.12Index Options ExpirationLowKOSPI 200 options expiration
This article was automatically summarized and analyzed based on the original news report. View the original article (Maeil Business Newspaper Securities)