
At a Glance
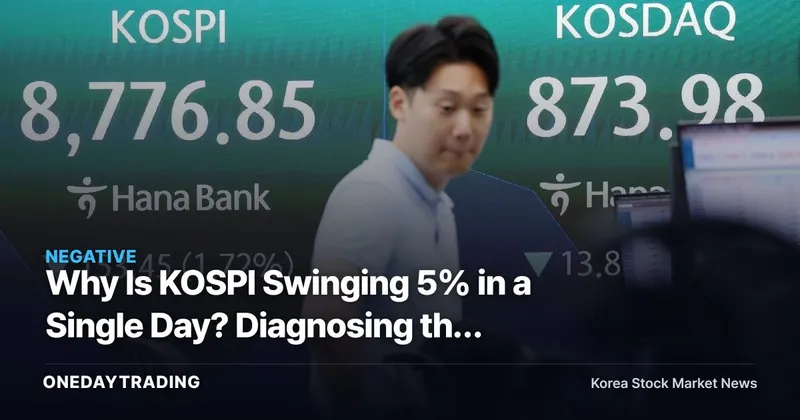
The domestic equity market has entered a phase of extreme volatility, with daily price change rates of -9.99%, +3.26%, +5.42%, and -5.81% repeating within just a few sessions — triggering buy-side sidecars, sell-side sidecars, and circuit breakers in sequence. The key point is that this is not merely a matter of positive or negative catalyst news; the market's very price-discovery function is breaking down.
In this kind of market environment, what investors should examine first is not individual stock (ticker) positive catalysts, but the structural causes of the volatility itself. When the index is heavily concentrated in large-cap semiconductor names and leverage has been building, the price reaction to any given piece of news can be amplified several times over compared to normal conditions.
Why This Matters Now
Sidecars and circuit breakers are safety mechanisms that temporarily halt program trading or all trading when futures or spot prices move beyond a certain threshold. The fact that a buy-side sidecar was followed almost immediately by a sell-side sidecar, and then by a circuit breaker, means that within a single trading session, buyer and seller market sentiment swung between extremes — with capital flooding in one direction and then rushing out again, repeatedly. Volatility is synonymous with risk, and the wider the swings, the more likely stop-loss orders and forced liquidations are to cascade.
Structurally, three factors are being identified. The first is profit-taking. When a stock (ticker) that has risen rapidly to a certain level sees a flood of sellers locking in short-term gains, an uptrend can reverse all at once. The second is semiconductor concentration. Because large-cap semiconductor stocks account for a substantial share of KOSPI market capitalization, the performance of this industry sector drives the entire index, and the market moves as a whole depending on the direction of foreign investors and institutional investors' semiconductor trades. The third is leverage. When margin loan positions and leveraged or inverse ETFs accumulate, a decline triggers forced liquidations, those liquidations drive further declines, and those further declines trigger yet more forced liquidations — a vicious cycle that amplifies volatility.
In other words, the current wild swings are less a reflection of deteriorating fundamentals per se and more the product of an amplification mechanism created by supply-demand (order flow) structure and derivatives and leverage. This distinction is the single most important analytical inflection point.
Frequently Asked Questions
- What is the difference between a sidecar and a circuit breaker? — A sidecar is a first-line buffer that halts program trading for five minutes when futures prices move sharply. A circuit breaker is a stronger measure that suspends spot market trading for a set period when the index itself drops beyond a certain threshold. When both are triggered back-to-back, it is a signal that the market shock is that much more severe.
- Why does semiconductor concentration amplify volatility? — When a stock (ticker) with a large index weight becomes unstable, the absolute point-move of the index grows larger even for the same percentage change. This is a structure in which a sector-specific issue transmits into systemic market risk.
- Is this a buying opportunity? — During a phase of expanding volatility, rebounds can be large, but so can additional sharp drops (plunges). Buying in bulk when no directional trend has been established may result in an asymmetric risk-reward profile.
- Why is leverage a problem? — Leveraged positions trigger forced liquidations during a decline, and those forced sales become the fuse for a chain reaction that drives prices even lower.
Related Stocks (Tickers) and Sector Impact
- Samsung Electronics & SK Hynix — These large-cap semiconductor stocks with heavy index weights are both the epicenter and the consequence of market volatility. Because the entire index tends to move in sync with foreign investors' supply-demand (order flow) direction in these names, their trading flow is the barometer of volatility.
- Brokerage stocks (Mirae Asset Securities, Samsung Securities, etc.) — A spike in trading value is a short-term positive catalyst for commission revenue, but forced liquidation volumes, system strain, and margin loan balance risk create a double-edged dynamic.
- Leveraged and inverse ETFs — Trading activity increases during volatile markets, but due to the daily compounding structure, tracking error accumulates over time and losses can become surprisingly large for long-term holders.
- High-dividend, low-volatility defensive stocks — During sharp gain (surge) and sharp drop (plunge) episodes, these names tend to fall less sharply and may attract safe-haven flows, but they can still be dragged down in a broad market decline.
Key Considerations for Investors
- Monitor margin loan balances and forced liquidation volumes daily to assess whether leverage unwind pressure has peaked.
- Track the net buying and net selling trends of foreign investors and institutional investors in semiconductors as a leading indicator of index direction.
- During periods of expanding volatility, reduce the risk of one-directional bets by scaling into positions gradually and maintaining a cash buffer.
- Monitor how the USD/KRW exchange rate and U.S. equity and semiconductor index movements feed into domestic supply-demand (order flow).
Overall Outlook
In the optimistic scenario, once profit-taking supply is absorbed and semiconductor industry conditions and foreign investor supply-demand (order flow) stabilize, the current volatility concludes as a supply-demand (order flow) correction rather than fundamental deterioration, and the index quickly finds equilibrium. Conversely, if margin and leverage unwinds continue or large-cap semiconductor supply-demand (order flow) becomes destabilized again, sharp drops (plunges) could extend despite the safety mechanisms triggering, putting the index floor back under test. The key variables are the pace at which profit-taking supply is digested, whether foreign net buying in semiconductors resumes, and the trajectory of margin loan balance reduction. The most practical gauge for navigating this volatile phase is to verify, through data from the next several trading sessions, whether all three of these indicators stabilize simultaneously.
Samsung Electronics — Real-Time Data Snapshot
Samsung Electronics's most recent closing price was KRW 339,500 (down 5.30% from the prior session), and the signal incorporating foreign investor and institutional investor supply-demand (order flow) along with news and momentum is 🔴 Caution. Foreign investors, institutional investors, and momentum are all negative, warranting caution at this time.
- ▼ Supply-demand (order flow) continuity — Foreign investors have been net sellers for 6 consecutive sessions (−KRW 2,014.2 billion)
- ▼ Dual-sided selling — Foreign investors −KRW 2,014.2 billion · institutional investors −KRW 1,209.4 billion selling in tandem
- ▲ 52-week positioning — At 89% of the 52-week range — approaching all-time high territory
Recent related news shows 21 positive catalyst items and 19 negative catalyst items, a slightly favorable balance.
※ Price and foreign investor/institutional investor supply-demand (order flow) data are provided by Korea Investment & Securities (KIS) and reflect conditions as of the time of publication.
This content was automatically summarized and analyzed based on the original news article. Read original article (Maeil Business News — Securities)