
What the KOSPI Chuseok Effect Tells Investors
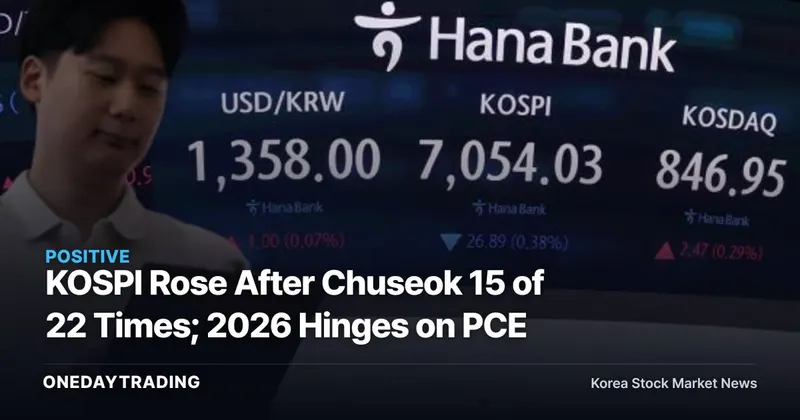
More important than statistics showing that the KOSPI rose after Chuseok is whether the same pattern will hold in 2026. According to Korea Exchange (KRX) data reported by Asia Business Daily Securities on September 28, the KOSPI rose during the first five trading days after 15 of the 22 Chuseok holidays from 2004 through 2025. This does not guarantee gains; it simply shows that the market rose more often than not after the holiday.
The Chuseok effect refers to a recurring short-term pattern in KOSPI returns and trading activity around the Chuseok holiday. Historical averages are only a starting point. Actual returns for 2026 have yet to be confirmed and should be assessed alongside scheduled U.S. inflation and employment data and Micron Technology earnings.
Korea Exchange (KRX) Analysis of 22 Holidays Shows a Clear Post-Holiday Rebound
According to the Korea Exchange (KRX) analysis, the KOSPI posted an average return of -0.05% in the five trading days immediately before Chuseok from 2004 through 2025, rising on 11 occasions. In the five trading days immediately afterward, the average return was +1.34%, with gains on 15 occasions, or 68% of the time. Even within the same market and period, the difference between pre- and post-holiday performance was clear.
Narrowing the period to 2021 through 2025, the KOSPI averaged -0.82% over the five trading days before the holiday and +0.77% over the following five sessions. Data covering 2001 through 2025 showed 16 gains and nine declines in the first five trading days after the holiday, with an average return of 0.51%. The directional pattern was similar across samples, although the size of the gains varied.
The KOSPI Volatility Hidden Behind the Averages
Focusing only on averages obscures the wide variation in annual results. The KOSPI rose 6.65% over the five trading days immediately after the 2004 Chuseok holiday, but returned -2.77% in 2018 and -3.84% in 2022. In 2022, even a 2.74% gain on the first trading day failed to ensure that the rally would continue.
By contrast, the KOSPI returned 3.89% over the five trading days after the 2025 Chuseok holiday. The frequency of 15 gains therefore should not be treated as a forecast for any particular year. What the data confirm is a recurring seasonal pattern, not the actual KOSPI outcome for 2026.
Korea Investment & Securities Trading Value Signals Renewed Order Flow
Trading value is the first figure to watch, even before prices. Korea Investment & Securities data show that the KOSPI’s five-day average trading value declined from 10.7 trillion won to 9.9 trillion won before the holiday during 2021–2025, then increased to 11.6 trillion won afterward. This indicates that trading participation also recovered when post-holiday gains emerged.
The turn-of-the-month effect should be treated only as supplementary evidence. According to a Korea Industrial Economics Association analysis covering January 1990 through December 2012, the KOSPI 200 averaged a 0.4% return across the final day of a month and the first day of the next month. Because both the analysis period and the applicable window differ from the Chuseok data, this finding alone cannot explain the market’s direction in 2026.
Samsung Electronics and SK Hynix Saw Divergent Foreign Order Flow
- Samsung Electronics: The stock closed at 285,500 won on the 23rd, up 3.25%. Foreign investors made net purchases of 2.5972 trillion won in Samsung Electronics from the 21st through the 23rd. If this buying continues after the holiday, it would strengthen the case for favorable short-term KOSPI supply-demand (order flow).
- SK Hynix: The stock closed at 1.86 million won on the 23rd, up 1.20%, but foreign investors remained net sellers. Gains in both semiconductor stocks should not be interpreted as evidence that foreign investors viewed them the same way.
- Micron Technology: The company is scheduled to report earnings on September 30. Consensus estimates call for revenue of $52 billion and earnings per share of $32.5–$33, while investors will also assess whether it can maintain a margin of about 86% in the next quarter.
Volatility also declined. The V-KOSPI 200 fell from 97.99 in June to 42.98 on September 23. This reflects the market environment immediately before the holiday but does not determine the direction after it.
PCE and Employment Data Will Shape Bullish or Bearish Scenarios
The bullish scenario would see the historical post-holiday recovery in trading value continue alongside foreign investor buying of Samsung Electronics, while Micron Technology’s earnings meet expectations. Another confirmed condition is the extension of the existing U.S.-China trade truce through January 10, 2027.
The bearish scenario would emerge if scheduled data diverge from market expectations. Consensus forecasts for the August U.S. PCE report, due September 30, call for headline PCE inflation of 3.7% and core PCE inflation of 3.4%. If the actual figures exceed expectations, the market’s response to the new data would take precedence over the “Chuseok effect.”
The September U.S. employment report and South Korea’s September consumer inflation data are scheduled for release on October 2. The U.S. unemployment rate is expected at 4.1%, with nonfarm payrolls forecast to increase by 83,000, compared with a gain of 162,000 in August. Until the gap between forecasts and actual results is known, there is no basis for determining the market’s direction in advance.
What Investors Should Check After the Holiday
- Compare the actual August U.S. PCE readings released on September 30 with forecasts of 3.7% for headline inflation and 3.4% for core inflation.
- On the same day, review Micron Technology’s actual revenue and earnings per share and whether it can maintain a margin of about 86% in the next quarter.
- Determine whether foreign investor buying concentrated in Samsung Electronics continues and whether net selling of SK Hynix reverses.
- Monitor the reactions of the KOSPI and V-KOSPI 200 after the September U.S. employment report and South Korea’s September consumer inflation release on October 2.
Historical statistics point to favorable odds at the start of post-holiday trading. The triggers that could change the outlook are not the calendar itself, but PCE data, Micron Technology earnings, employment and inflation figures, and semiconductor supply-demand (order flow).
Key Samsung Electronics MetricsAs of 2026-09-28
| Period Return | 1 Week +8.42% 1 Month +4.68% |
|---|---|
| Trading Value · Trading Volume | 317.3 billion won · 24,674,092 shares |
| Supply-Demand (Order Flow) | Foreign Investors −581.3 billion won net sold Institutional Investors −127.7 billion won net sold |
| Recent News Tone | 5 positive catalysts · 3 negative catalysts |
Price and supply-demand (order flow) data are real-time figures from Korea Investment & Securities (KIS), while supply-demand (order flow) and news-tone counts are calculated independently by OneDayTrading.
Order Flow and Momentum Assessment🔴 Caution
Foreign investor, institutional investor, and momentum indicators are showing negative signals.
- ▼Joint SellingForeign investors −581.3 billion won · institutional investors −127.7 billion won in simultaneous net selling
- ▲News Flow5 positive catalysts vs 3 negative catalysts — positive catalysts prevail
Upcoming Events to Watch
- 10.08Index Options ExpirationLowKOSPI 200 options expiration
- 10.22Bank of Korea Monetary Policy BoardHighBenchmark interest rate decision meeting
- 10.28FOMC Policy Rate DecisionHighU.S. Federal Reserve monetary policy announcement — direction of interest rates and the dollar
- 11.12Index Options ExpirationLowKOSPI 200 options expiration
This article was automatically summarized and analyzed based on the original news report. View the original article (Asia Business Daily Securities)