Summary
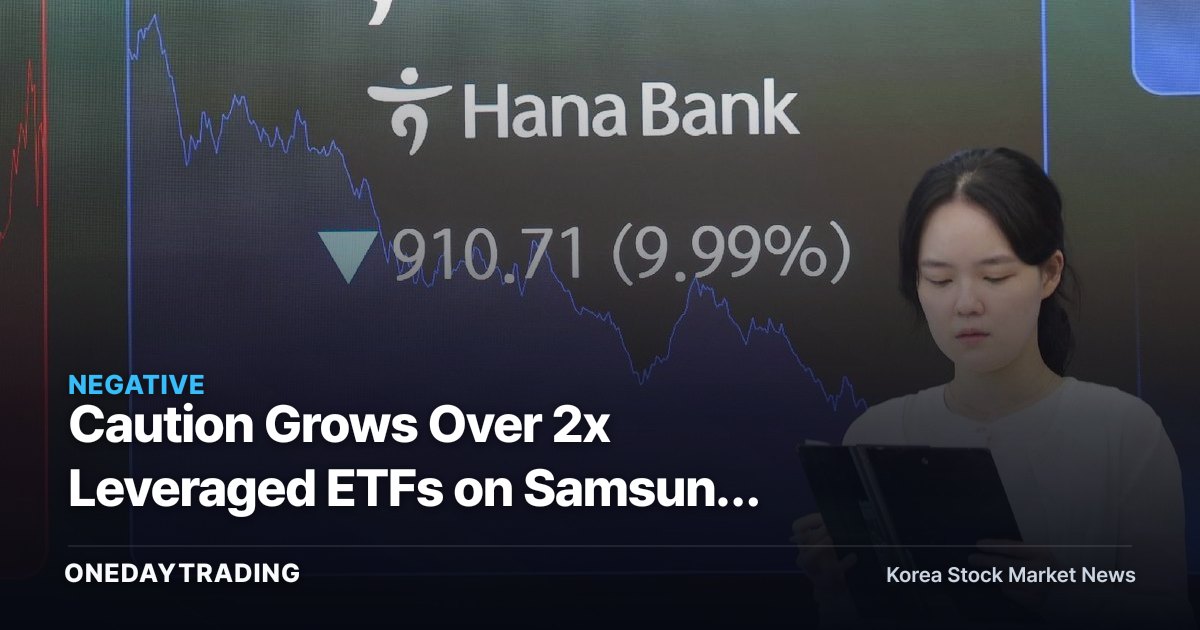
Caution is spreading over single-stock leveraged ETFs that track twice the daily moves of Samsung Electronics and SK Hynix. Because semiconductors are the core engine of Korea's stock market, the popularity of these products is a signal that retail money is crowding into volatility bets. The problem is that a structure replicating twice the daily return builds up losses faster during downturns than gains during rallies.
What Happened
Recently, warnings have grown louder in the market over single-stock leveraged ETFs that track twice the daily price swings of Samsung Electronics and SK Hynix. Both are semiconductor sector bellwethers near the top of the KOSPI by market capitalization, and they attract concentrated flows at both the index and individual-stock level.
The key feature of leveraged products is that they replicate twice the daily move rather than the cumulative return of the underlying asset. When a stock rises steadily in one direction, the compounding effect works in the investor's favor; but in sideways ranges where moves alternate, or during sharp drops (plunges), the rebound needed to recover the principal grows arithmetically larger. For example, if the underlying asset falls 10% in a day, the leveraged product loses about 20%, and recovering that requires a far larger rebound than the underlying asset alone.
Structural Background
Korea's single-stock ETF market has grown by rapidly absorbing the U.S.-style individual-stock leveraged products. Because the semiconductor cycle is sensitive to external variables such as memory prices and AI server demand, its high volatility has dovetailed with retail demand seeking large returns in a short time, driving brisk trading. Yet the higher the volatility, the stronger the volatility decay of the daily compounding structure, highlighting a structural weakness in which the gap between expected and actual performance widens when held long term.
Impact on Stocks and Sectors
- Samsung Electronics: As a sector bellwether with a large memory and foundry weighting, it is the most widely used underlying asset for single-stock leveraged products, so the profit-and-loss swings of the tracking products are largest when volatility expands.
- SK Hynix: With its share price driven by momentum in high-value memory such as HBM, it is a highly volatile stock, so the amplification of daily moves is even more pronounced when tracked with leverage.
- Asset management industry: Expanding single-stock and leveraged ETF lineups increases fee income, but it carries a double-edged risk as loss-related complaints and the possibility of tighter regulation rise simultaneously.
- Semiconductor materials, parts and equipment stocks: When the bellwethers' volatility rises, sentiment toward upstream equipment and materials stocks can be shaken in tandem, placing them within the zone of indirect impact.
Bullish vs. Bearish Scenarios
On the bullish side, if AI server and HBM demand leads a recovery in the memory cycle and both stocks trend higher, daily compounding works favorably and short-term tracking performance can outpace the underlying asset. Conversely, on the bearish side, if memory price corrections or exchange-rate and interest-rate variables cause frequent up-and-down moves, volatility decay accumulates, and a situation can arise where the leveraged product alone is left with losses even after the underlying asset returns to its starting point. The greatest risk comes from treating a short-term trading tool like a long-term holding.
Investor Action Points
- Clearly define the holding period. Daily-tracking products are for short-term responses measured in days; for a long-term directional bet, compare whether directly holding the underlying asset or a non-leveraged ETF is structurally more advantageous.
- Check volatility indicators. Examine whether trends in memory fixed-transaction prices (DRAM, NAND)—an inflection point for the semiconductor cycle—and HBM-related order disclosures signal expanding volatility.
- Calculate loss asymmetry. Simulate in advance how much larger the rebound needed to recover the principal after a decline is compared with the underlying asset.
- Check calendar variables. Watch the next quarterly earnings releases from Samsung Electronics and SK Hynix, exchange rate levels, and the U.S. semiconductor policy schedule as volatility triggers.
Samsung Electronics in Real-Time Data
Samsung Electronics' latest closing price is 334,500 won (+7.90% from the previous day), and the signal light combining foreign and institutional investor order flow with news and momentum is 🟡 Neutral · Wait-and-See. With positive and negative signals mixed, it is a period to watch.
- ▼ Order-flow continuity — Foreign investors net sellers for 3 consecutive days (−761.1 billion won)
- ▼ Twin-engine selling — Foreign investors −761.1 billion won · institutional investors −1,406.3 billion won selling in tandem
- ▲ 52-week position — In the upper 52-week range at 87% — new-high territory
- ▲ News flow — 27 positive catalysts vs. 17 negative catalysts — positive catalysts in the lead
Recent related news is favorable, with 27 positive catalysts and 17 negative catalysts.
※ Price and foreign/institutional investor order-flow data are provided by Korea Investment & Securities (KIS), as of the time of publication.
This article is content automatically summarized and analyzed based on the original news. View original (Maeil Business Newspaper, Securities)