S&P 500 Selling Outran the VIX Response
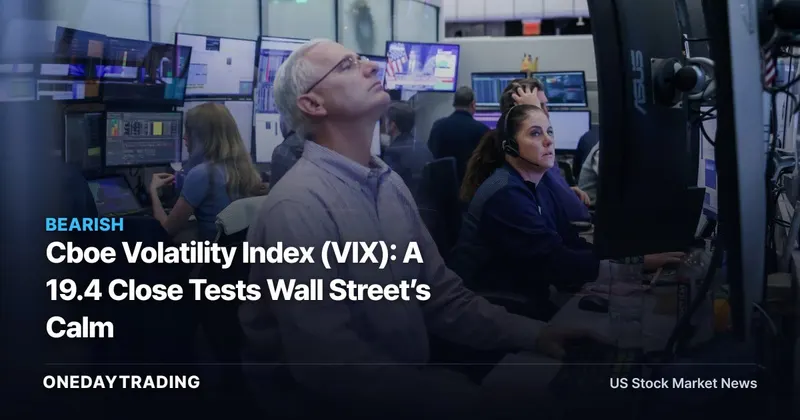
The S&P 500 fell nearly 2% on Friday and stocks completed their worst week since June, while the Cboe Volatility Index (VIX) closed at 19.4 index points, CNBC reported. For investors, the key signal is the divergence between decisive equity selling and a comparatively restrained repricing of index options.
The Cboe Volatility Index (VIX) is an options-based measure of expected S&P 500 volatility. It reached its highest intraday level since April on Friday before retreating to its 19.4 close, even as the equity benchmark remained under pressure.
That combination does not establish that the selloff is benign. It says traders did not respond to falling stocks with the degree of broad, urgent options demand that might normally accompany a move of this size. The distinction matters because subdued hedging can reflect confidence, selective protection, or a reduction of equity positions that leaves less exposure to insure.
SpotGamma Finds a Smaller-Than-Modeled Fear Move
SpotGamma’s Brent Kochuba described the Cboe Volatility Index (VIX) increase of 2.2 points on Friday as “relatively muted.” His analysis indicated a modeled response closer to 2.6 points, based on SpotGamma’s study of 126 selloffs since 2018.
The gap between the observed and modeled moves is the central tension in the tape. Equity losses were substantial enough to lift expected volatility, though the increase fell short of what Kochuba’s historical framework associated with comparable selloffs.
This is best read as evidence about the intensity of options demand, not a forecast for the next market move. The study describes how the VIX behaved against a modeled response; it does not determine whether the S&P 500, the VIX, or option prices will rise or fall from here.
Nasdaq 100 Options Showed Selective Protection
The muted response was not uniform across the options market. Implied volatility increased for most Nasdaq 100 Index option contracts, with exceptions that reveal traders were discriminating among strikes rather than buying every form of downside protection.
Data shared by Nasdaq’s Kevin Davitt showed that Nasdaq 100 Index puts positioned 20% to 50% out-of-the-money were more expensive on a volatility basis after the Oct. 16 sell-off. This comparison indicates that deeply out-of-the-money protection had attracted stronger relative pricing after that earlier decline than in the market conditions described on Friday.
The strike-by-strike pattern is more informative than treating “volatility” as one price. Implied volatility embeds the protection premium within an option, while skew describes how that premium varies across strikes. Selective demand can therefore lift parts of the options surface without producing a proportionate surge in the headline VIX.
Nomura Sees Little Rush Into Index Puts
Nomura managing director Charlie McElligott wrote that out-of-the-money S&P 500 Index puts “just aren’t being chased-into at this moment.” He also said index-options skew had shown limited reaction during the equity selloff, partly because call volatility was being compressed.
This observation sharpens the interpretation of the VIX close. A relatively quiet index can reflect changes in more than downside-put pricing; weaker call volatility can also restrain the overall options signal. The headline measure consequently should not be treated as a complete account of demand at every strike.
The evidence supports a narrow conclusion: options traders did not broadly escalate protection in proportion to Friday’s equity decline. It does not establish why each investor refrained from hedging, or whether asset managers’ stock sales caused the muted response.
Morgan Stanley Data Put Deleveraging at the Center
Morgan Stanley’s prime-brokerage data showed total global gross equity exposure among long-short active managers down 8% from its most recent peak. The firm identified that contraction as the largest drawdown in at least ten years.
Gross equity exposure measures the combined scale of long and short positions before they are offset against each other. When managers shrink both sides of the book, they reduce the amount of market exposure requiring protection; in principle, that can limit the need to purchase additional options hedges.
Zed Francis, CIO of Chicago-based Convexitas, characterized the episode as a “massive de-levering event.” His view was that managers had bought back shorts, sold longs and moved closer to cash, making deleveraging the main reason implied volatility stayed quiet during an increased-stress month.
That is a supported interpretation from a market participant, not a proven causal finding. The identities of the managers in Morgan Stanley’s data are not supplied, and the available evidence does not determine whether their stock selling produced the restrained options-market reaction.
The Debate Behind the 19.4 VIX Close
- Calm or reduced exposure: Limited demand for index protection could indicate composure, or it could mean managers had already cut positions and had less left to hedge.
- Headline VIX or the full surface: The Cboe Volatility Index (VIX) captured a restrained aggregate move, while Nasdaq 100 Index contracts showed that implied volatility still increased across most options.
- Current pricing or earlier protection: The Nasdaq evidence showed richer volatility pricing for puts 20% to 50% out-of-the-money after the Oct. 16 sell-off, underscoring that demand can shift across both time and strike.
- Observation or outlook: The options data describe positioning during the selloff. They do not establish future outcomes for stocks, volatility, or hedging demand.
S&P 500 and Nasdaq 100 Exposure
- S&P 500: The benchmark absorbed the nearly 2% Friday decline that anchors the comparison with the VIX response. Its next move cannot be inferred from subdued put demand alone.
- S&P 500 Index options: McElligott’s assessment points to limited pursuit of out-of-the-money puts, making changes in downside skew a direct test of whether protection demand is broadening.
- Nasdaq 100 Index options: Most contracts registered higher implied volatility, while exceptions and strike selection prevented a uniform repricing.
- Long-short active managers: Morgan Stanley’s exposure data indicate that position reduction, rather than options purchases alone, was an important feature of the stress episode.
What Would Change the Market’s Message
- VIX behavior during the next equity decline: Check whether the Cboe Volatility Index (VIX) again moves less than historical modeling implies or responds more forcefully.
- S&P 500 Index put demand: A broader pursuit of out-of-the-money protection would challenge the current picture of restrained hedging.
- Nasdaq 100 Index volatility by strike: Compare deeply out-of-the-money puts with the rest of the options surface to determine whether protection remains selective.
- Global gross equity exposure: Updated Morgan Stanley prime-brokerage data can show whether long-short active managers continue deleveraging or stop reducing their combined positions.
A Quiet Options Market Is Not an All-Clear
The constructive reading is that Friday’s nearly 2% S&P 500 decline did not trigger indiscriminate demand for protection. The cautious reading is that the calm may have followed an unusually large contraction in gross equity exposure, leaving fewer positions to hedge after managers had already reduced risk.
Investors should therefore separate the signal already visible in the tape from what remains unknown. The tape shows a 19.4 VIX close, a 2.2-point move that SpotGamma judged muted, selective Nasdaq 100 Index protection and an 8% retreat in managers’ gross exposure from its most recent peak. It does not price in a knowable path for the next stock-market move.
The next meaningful test will arrive with the next bout of equity stress: whether managers sell more stock, rebuild options protection, or show a broader repricing across index-option strikes. Until that evidence appears, the restrained VIX response is a positioning clue rather than proof that market risk has passed.
📊 Analysis
Signal Bearish
Why The S&P 500’s nearly 2% Friday decline and the sharp reduction in long-short managers’ gross equity exposure indicate elevated pressure despite restrained hedging demand.
This article was independently written by OneDayTrading from public reporting. Read the original (CNBC)