
What the Nasdaq Composite’s Rise Signals
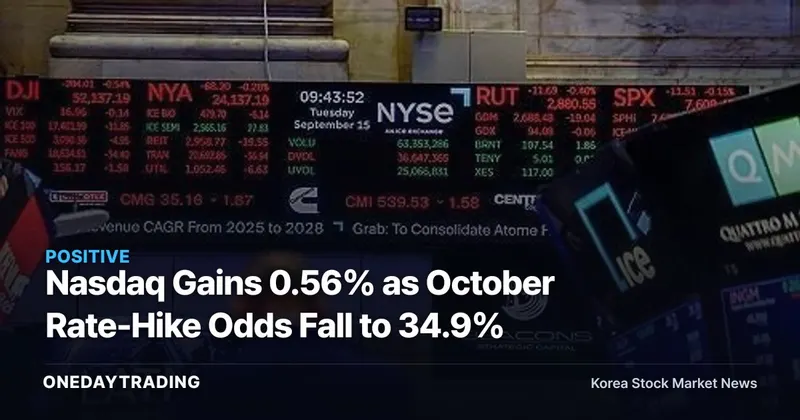
The Nasdaq Composite’s 0.56% gain as of 9:43 a.m. local time on September 30, 2026, does not mean the inflation problem is over. It shows that the market priced in a lower immediate risk of an October rate hike. For Korean investors, the priority is not gauging how long the rebound in U.S. technology stocks will last, but tracking how rate expectations shift in response to inflation and growth.
According to Yonhap News Securities’ report on trading at the New York Stock Exchange, all three major indexes opened higher. The Dow Jones Industrial Average rose 1.67 points from the previous session to 51,351.59, while the Standard & Poor’s (S&P) 500 gained 24.14 points to 7,694.98. The Nasdaq Composite jumped 151.18 points to 26,948.73.
U.S. PCE Data Eases October Rate Concerns
The PCE price index measures changes in inflation based on personal consumption expenditures. The U.S. Commerce Department reported that the core PCE price index rose 0.2% month over month in August, while the headline PCE price index increased 0.3%. Although the specific market forecasts were not provided, both readings were confirmed to have come in below expectations.
The CME FedWatch Tool showed a 34.9% probability of a 25bp increase in the benchmark interest rate in October, down from 50.9% at the previous day’s close. The distinction between what has and has not been confirmed is clear: the market has reduced the expected pressure from an October hike, but the actual rate decision remains unknown.
The Remaining Gap to the Federal Reserve’s Target
Core inflation remains too high to focus solely on the relief. The core PCE price index rose 3.0% year over year in August, exceeding the Federal Reserve’s annual inflation target of 2%. Inflation was simultaneously lower than expected and still above the Fed’s target.
The expected timing of a rate increase also shifted further out. The probability of a 25bp hike by December rose from 49.4% to 59.4%. That is why easing pressure for an October hike does not mean expectations for an increase this year have disappeared. Short-term relief is already reflected in prices, while it remains difficult to determine whether the actual path of the benchmark interest rate has been fully priced in.
U.S. GDP Adds a Second Variable
The U.S. Commerce Department’s final estimate showed second-quarter GDP growing at a seasonally adjusted annualized rate of 2.2% from the previous quarter, beating the market forecast of 1.5%. The figure was also 0.7 percentage points higher than the previous estimate. The combination was milder-than-expected inflation alongside stronger growth.
Real final sales to private domestic purchasers increased 4.6% in the second quarter, accelerating from 1.8% in the first quarter. Adam Hetts of Janus Henderson Investors said the inflation readings were better than expected, but added that strong employment and GDP were unlikely to derail expectations for another rate hike by year-end. If growth remains resilient, rate expectations could shift again.
Big Tech Strength Contrasts With Semiconductors
- Apple, Alphabet, Microsoft, Amazon and Nvidia: Each rose around 2% on September 30, 2026. Buying that day was concentrated in technology giants with market capitalization of at least $1 trillion, although the precise gain for each company was not provided.
- Meta, Tesla and SK hynix: These stocks edged lower, including SK hynix’s U.S. depositary receipts. This shows that relief over the PCE data did not produce a uniform price direction even among technology stocks.
- Philadelphia Semiconductor Index: The index gained just 0.2%. AMD, ASML and Arm declined, while TSMC, Broadcom and Micron Technology posted only modest gains, leaving the index’s advance weaker than that of the Nasdaq Composite.
Expectations for lower interest rates can support the valuations of technology stocks, whose prices depend heavily on future earnings. Conversely, if the probability of a hike this year rises further, the assumptions used to justify high multiples would be the first to come under pressure. The divergence among individual stocks that day makes it difficult to interpret the index’s rise as a uniform signal for the entire technology sector.
Oil and European Stocks Send Different Signals
At the same time, West Texas Intermediate (WTI) crude for November 2026 delivery rose 2.19% from the previous session to $91.33 per barrel. The Euro Stoxx 50 fell 0.58% to 6,283.39, while Germany’s DAX declined 0.40%, France’s CAC 40 lost 0.56% and the U.K.’s FTSE 100 slipped 0.04%. There is insufficient evidence to interpret New York’s gains as a broad-based rally across all risk assets.
What Korean Investors Should Monitor Next
- October rate expectations: Investors should watch whether the CME-implied 34.9% probability of a 25bp hike begins rising again.
- The path through December: If the 59.4% probability of a 25bp hike declines, the case for easing valuation pressure on technology stocks will gain traction. If it rises, the gap between short-term relief and this year’s rate risk will narrow.
- Inflation’s progress toward target: The key turning point will be whether core PCE inflation, currently 3.0% year over year, declines toward the Federal Reserve’s 2% annual target.
- Whether gains broaden across stocks: Investors should determine whether the roughly 2% gains in Big Tech spread to the Philadelphia Semiconductor Index and currently weaker stocks.
Two Diverging Paths After PCE Relief
The optimistic scenario is that below-forecast inflation and strong GDP persist while the pressure for an October hike remains subdued. Under this scenario, the early strength in New York stocks would have room to broaden beyond Apple, Alphabet, Microsoft, Amazon and Nvidia to the wider technology sector.
The risk scenario is that core PCE inflation continues to exceed the Federal Reserve’s target while the probability of a hike by December climbs further. The calculation changes once the actual rate decision takes precedence over the day’s relief from the PCE data. The next point to watch is not the index’s intraday gain, but the direction of the probabilities for October and December rate hikes.
Key Nvidia MetricsAs of 2026-10-01
| Period Returns | 1 Week +2.33% 1 Month +4.52% |
|---|---|
| Recent News Tone | Positive Catalysts 9 · Negative Catalysts 0 |
Price and supply-demand (order flow) data are real-time figures from Korea Investment & Securities (KIS), while supply-demand (order flow) and news-tone readings are calculated independently by One Day Trading.
Supply-Demand (Order Flow) and Momentum Assessment🟢 Buying Dominates
News and momentum indicators are showing positive signals.
- ▲Trend AlignmentShort- and medium-term upward alignment (Today +1.6% · 1 Week +2.3% · 1 Month +4.5%)
- ▲52-Week PositionAt 92% of its 52-week range — near record-high territory
- ▲News FlowPositive catalysts 9 vs negative catalysts 0 — positive catalysts dominate
This article was automatically summarized and analyzed from the original news report. View the original article (Yonhap News Securities)