Key Takeaways
Fed Chair Kevin Warsh is reportedly considering dropping the dot plot — the chart in the Federal Open Market Committee's (FOMC) quarterly economic projections that plots each member's individual interest-rate forecast as a dot. Since its introduction in 2012, the dot plot has been the most direct signal the market uses to read the future path of rates. If this tool disappears, policy visibility would shrink, potentially widening the uncertainty premium across bond, foreign-exchange, and stock markets in the near term.
What Happened
Each quarter, the FOMC releases its Summary of Economic Projections (SEP), in which members mark the policy rate level they consider appropriate as dots. Traders and economists look at the median and distribution of these dots to adjust market expectations for the number of cuts or hikes within the year and for the long-run neutral rate.
If Chair Warsh stops publishing this dot plot, the market will lean more heavily on the chair's press-conference remarks, the wording of the statement, and individual members' speeches. With quantified guidance gone, there is more room for interpretations to diverge over the same data.
Background and Context
The dot plot has also drawn criticism for fueling excessive market swings. The concern is that members' simple forecasts get treated almost like commitments, constraining policy flexibility. Warsh has long been wary of the Fed over-signaling and the market's dependence on it, so withholding the dot plot can be seen as an extension of that philosophy. That said, the opposite assessment — that it represents a retreat from transparency — coexists.
Impact on the Market and Stocks
- Bank and financial stocks: Lower visibility on the rate path increases volatility in net interest margin (NIM) forecasts. For names like KB Financial and Shinhan Financial Group, the widening of forecasting uncertainty — rather than the direction of rates itself — could become a valuation variable.
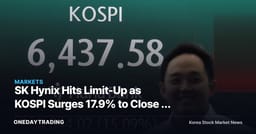
- Growth and tech stocks: Large export names sensitive to foreign investors' supply-demand (order flow) and U.S. interest rates, such as Samsung Electronics and SK hynix, tend to see volatility expand when expectations for the discount rate (interest rates) are shaken.
- KRW/USD exchange rate: If the Fed's signals turn ambiguous, bets on the dollar's direction may weaken or short-term crowding may intensify, bringing exchange-rate-sensitive export names such as Hyundai Motor, along with import-heavy sectors like airlines and oil refining, into the affected zone together.
- Bond and brokerage stocks: A guidance vacuum amplifies government bond yield volatility, affecting bond valuation gains and losses and trading revenue.
Investor Checkpoints
- Watch whether the dot plot is actually dropped at the FOMC announcement, and what form of rate outlook (such as narrative guidance) is presented instead.
- In the absence of the dot plot, observe how the market reacts to the chair's press-conference remarks and changes in the statement's wording, and track the swing in U.S. 2-year and 10-year Treasury yields.
- Check for shifts in risk-asset appetite through the KRW/USD exchange rate level and foreign investors' net buying flows in the KOSPI.
- Compare whether volatility around the next U.S. Consumer Price Index (CPI) and employment data releases widens versus the past.
Outlook
A positive reading is also possible: scrapping the dot plot could reduce market overreaction and, over the medium to long term, enhance policy flexibility. The Fed would gain more room to respond to the data without being tied down by specific numbers. Conversely, a scenario in which the market — having lost a key gauge — grows more sensitive to a single remark and short-term volatility actually rises cannot be ruled out. Whether the change is in fact finalized and implemented, and whether the market absorbs it smoothly at the first meeting where it applies, will likely be the turning point that determines the direction.
This article is content automatically summarized and analyzed based on the original news. View Original (CNBC)