
What the KOSPI’s Reversal After a Higher Open Means
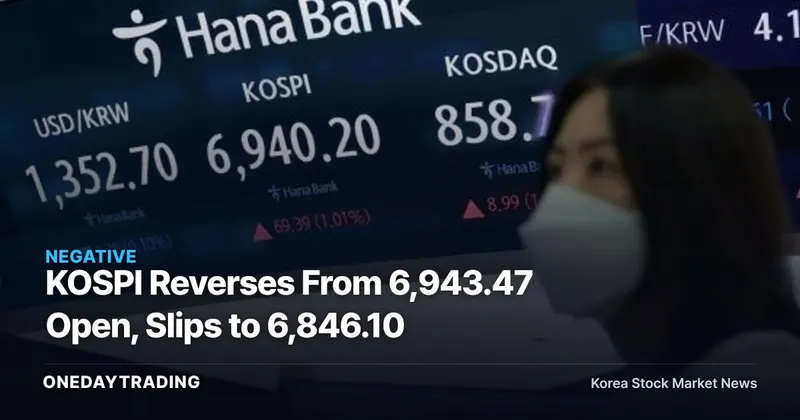
The KOSPI’s retreat into the 6,800 range on the 30th after giving up its opening gains shows that the sustainability of intraday supply-demand (order flow) has become more important than the index’s starting level. According to Asia Economy’s securities report, the KOSPI was trading at 6,846.10 points at around 11:45 a.m. on the 30th, down 0.36% from the previous session. At this point, investment decisions should go beyond viewing the index direction as a single broad move and begin by distinguishing between the sellers and the stocks that remained higher.
An intraday reversal into negative territory means that an index that opened higher fell below the previous session’s level during trading. The higher open itself did not establish a trend, and individual stocks’ price moves were not aligned in the same direction. What this really indicates is a divergence between the index and individual stocks, rather than uniformly weak conditions across the entire market.
Intraday Move From 6,943.47 to 6,846.10
At the opening on the 30th, the KOSPI stood at 6,943.47 points, up 1.06%, or 72.66 points, from the previous session. By around 11:45 a.m., it had fallen to 6,846.10 points, turning the price change rate versus the previous session to a decline of 0.36%. Together, the two figures show that the optimism established immediately after the open did not hold through the same day’s intraday trading.
It is important to separate what has been confirmed from what has not. The confirmed development is the reversal into negative territory after a higher open. The data provided are insufficient to determine the KOSPI’s closing price for the day or whether this trend persisted.
How Foreign, Institutional and Retail Investors Split KOSPI Order Flow
During KOSPI trading on the 30th, foreign investors recorded net selling of 599.9 billion won and institutional investors sold a net 545.0 billion won, while retail investors bought a net 374.8 billion won. With buyers and sellers divided by investor group, retail investors’ net buying alone cannot be taken to imply an index recovery, while foreign and institutional selling should not be used to predetermine the day’s closing price.
- Combined net selling by foreign and institutional investors can be viewed as supply-demand (order flow) pressure at the point when the KOSPI failed to retain its opening gains.
- Retail investors were net buyers, but the KOSPI remained below the previous session’s level at around 11:45 a.m.
- Intraday net trading figures are not final and should be distinguished from investor flows recorded after the market closes.
- If net selling by foreign and institutional investors continues, pressure on the index will remain; if their trading direction reverses, the interpretation of the intraday move will also change.
Samsung Electronics’ Decline Contrasts With SK Hynix’s Gain
The index decline did not mean that all stocks fell together. During trading on the 30th, Samsung Electronics fell 1.01%, while Samsung Electro-Mechanics declined 0.79%, Hyundai Motor 1.00%, KB Financial Group 1.67%, Samsung Life Insurance 2.75% and Samsung C&T 0.43%. The simultaneous weakness across different companies shows that the KOSPI’s intraday reversal was not confined to a single stock.
In contrast, SK Hynix rose 1.19%, SK Square 1.07%, LG Energy Solution 0.85% and Samsung Biologics 0.94%. Some stocks remained higher even as the market declined. Interpreting an index decline as weakness across every constituent would overlook the actual price action.
- Samsung Electronics was among the stocks that reversed lower alongside the KOSPI.
- SK Hynix and SK Square maintained upward momentum even as the index declined.
- LG Energy Solution and Samsung Biologics were also higher at the same point in intraday trading.
- Hyundai Motor, KB Financial Group, Samsung Life Insurance and Samsung C&T were among the decliners.
KOSDAQ at 854.54, Moving in the Opposite Direction From KOSPI
At the same time, the KOSDAQ was trading at 854.54 points, up 0.56% from the previous session. Its direction differed from the KOSPI’s 0.36% decline, making it difficult to characterize the day’s intraday market solely as a broad risk-off move.
In the KOSDAQ market, retail investors recorded net selling of 4.6 billion won and foreign investors sold a net 1.5 billion won, while institutional investors posted institutional net buying of 16.8 billion won. Retail investors were net buyers and institutional investors were net sellers in the KOSPI, but the opposite pattern emerged in the KOSDAQ. The fact that the same investor groups traded in different directions across the two markets is a key clue behind the indices’ divergence.
Market-Close Checkpoints for Investors
- Investors should check whether the KOSPI maintains its downward move around 6,846.10 points or reverses higher again.
- The supply-demand (order flow) interpretation will change depending on whether intraday net selling of 599.9 billion won by foreign investors and 545.0 billion won by institutional investors expands or narrows by the close.
- Whether Samsung Electronics and SK Hynix continue moving in opposite directions will help distinguish index weakness from divergence among individual stocks.
- Whether the KOSDAQ’s gain and institutional net buying remain in place at the close will be the benchmark for assessing the divergence between the two indices.
Two Scenarios to Be Confirmed by Closing Prices
In the bullish scenario, net selling by foreign and institutional investors narrows and the KOSPI reverses higher again. In that case, the intraday decline would be limited to volatility following the higher open. If SK Hynix, SK Square, LG Energy Solution and Samsung Biologics also retain their gains, the divergence among individual stocks would continue.
The downside scenario would emerge if net selling by foreign and institutional investors expands and weakness persists in Samsung Electronics and other declining stocks. Under those conditions, the intraday setup in which retail investors’ net buying alone is insufficient to reverse the index would continue. The final decision points will be the KOSPI and KOSDAQ closing prices for the day and each investor group’s final net trading figures.
KOSPI Index MetricsAs of 2026-09-30
| Performance by Period | 1 Week -2.25% 1 Month +0.90% |
|---|
Index, commodity and exchange rate figures are based on global markets and reflect values at the time of publication.
Samsung Electronics Key MetricsAs of 2026-09-30
| Returns by Period | 1 Week -2.01% 1 Month +4.47% |
|---|---|
| Trading Value · Trading Volume | 315.0 billion won · 11,948,195 shares |
| Supply-Demand (Order Flow) | Foreign Investors Net selling of 212.6 billion won (3 consecutive days) Institutional Investors Net selling of 46.7 billion won |
| Recent News Tone | Positive Catalyst 7 · Negative Catalyst 9 |
Price and supply-demand (order flow) data are real-time figures from Korea Investment & Securities (KIS), while supply-demand (order flow) and news-tone tallies are independently calculated by One Day Trading.
Upcoming Events to Watch
- 10.08Index Options ExpirationLowKOSPI200 options expiration
- 10.22Bank of Korea Monetary Policy BoardHighBenchmark interest rate decision meeting
- 10.28FOMC Policy Rate DecisionHighU.S. Federal Reserve monetary policy announcement — direction of interest rates and the dollar
- 11.12Index Options ExpirationLowKOSPI200 options expiration
This article was automatically summarized and analyzed based on the original news report. View the original article (Asia Economy Securities)