
What Reuters’ Report of Gold’s Sharp Drop (Plunge) Means
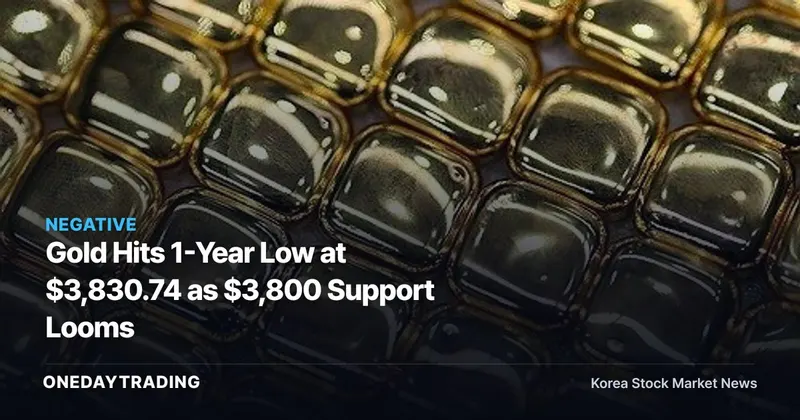
International gold prices fell as low as $3,830.74 per troy ounce during intraday trading on the 16th local time, Reuters reported. This signals more than a routine price correction. Despite continued buying by physically backed exchange-traded funds and central banks, expectations surrounding interest rates and the dollar exerted greater influence over pricing.
The spot gold price is the price of gold for immediate delivery, while one troy ounce is approximately 31.1g. The price was its lowest since October 2 last year and 31.5% below January’s all-time high of $5,594.82. The scale of the decline is clear, but it remains uncertain whether this move will cement gold’s weakest annual performance since 2015.
FXCM Highlights the Price Path Through Rates and the Dollar
FXCM’s Nikos Tzabouras said that when the market expects higher interest rates, the dollar rises, intensifying the negative catalyst for gold and exposing it to a deeper decline. The path runs from interest-rate expectations to the dollar and then to downward pressure on gold. If expectations for higher rates persist, gold prices will remain under pressure; if those expectations reverse, the outlook changes.
Negative expectations for interest rates and the dollar are already reflected in the price. What remains difficult to assess is whether ETF and central-bank buying is strong enough to halt the decline. Investors evaluating gold-related assets should therefore look beyond the size of the loss and first determine whether interest-rate expectations and the dollar are turning together.
WGC Buying and ETF Inflows Reveal Gold’s Defensive Floor
Physically backed gold ETFs recorded inflows of 211t in the third quarter. The World Gold Council (WGC) estimated that central banks worldwide purchased 675t of gold from January through September. Investors should recognize both that institutional demand persisted while prices fell and that this demand alone was unable to stop the decline.
- ETFs: Third-quarter inflows of 211t show that investment demand for physically backed gold remained intact.
- Central banks: The World Gold Council’s (WGC) estimate of 675t purchased from January through September indicates that official-sector buying remained in place.
- China’s central bank: It has continued buying gold for a second year, supporting local investor sentiment in China.
- Poland: Its reserve target is 700t, but it has not been confirmed whether purchases actually stopped in November.
Conditional Impact on Gold ETFs and the Commodities Sector
Falling gold prices are a direct downside factor for the valuation of products that track gold. Conversely, ETF inflows and central-bank purchases indicate that demand remains beneath the market. With these two forces in opposition, investors should not determine the direction of related products from the decline alone, but should confirm whether prices and buying activity turn in the same direction.
Analysts identify $3,800 as the psychological support level. If gold remains above it, the next criteria will be whether the support holds and institutional buying continues. A move below $3,800 would weaken confidence in the existing floor and signal an increased risk of further declines.
Three Indicators That Will Determine the Next Move
- Price: Watch whether the spot gold price remains above the psychological support level of $3,800.
- Fund flow: Check whether inflows into physically backed gold ETFs continue.
- Official-sector demand: Monitor the World Gold Council’s (WGC) estimates of central-bank purchases and whether China’s central bank continues buying.
- Macro conditions: The turning point will be whether the interest-rate expectations and dollar trend highlighted by Nikos Tzabouras reverse.
The bullish scenario is for the $3,800 level to hold while ETF and central-bank buying continues. The downside scenario would be driven by persistent expectations for higher interest rates and continued dollar pressure. With gold’s next move still uncertain, investment decisions should focus on how the support level, fund flow, and rate and dollar expectations move together.
International Gold IndicatorsAs of 2026-11-17
| Performance by Period | 1 Week -3.88% 1 Month -6.88% |
|---|
Index, commodity, and exchange rate data are based on global markets and reflect values at the time of publication.
This article was automatically summarized and analyzed based on the original news report. View original article (Yonhap News Agency Markets)