S&P 500 Correction Resets the AI and Rate Trade
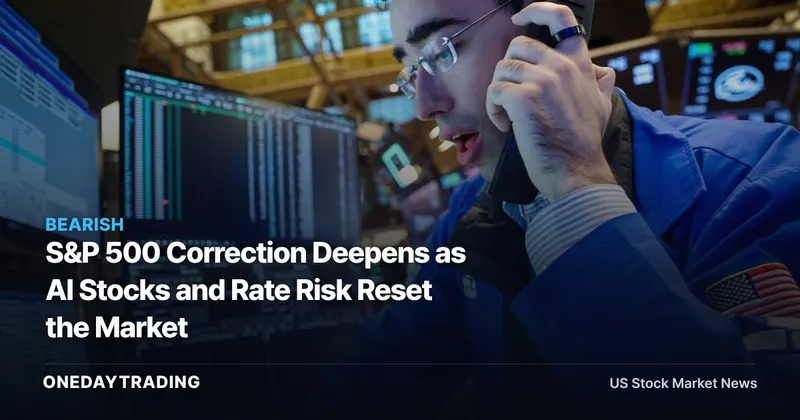
The S&P 500 correction now challenges both AI valuations and the broader market’s tolerance for higher rates. On November 20, 2026, CNBC reported that the S&P 500 and Dow Jones Industrial Average closed more than 10% below their records, while the Nasdaq Composite surrendered its gain for the year.
A correction is a decline of more than 10% from a market record. This episode extends beyond that threshold: the Nasdaq-100 entered bear-market territory on an intraday basis, and losses spread through Nvidia, CoreWeave and Caterpillar. The central issue for investors is no longer whether a single AI stock became expensive, but whether slowing growth, rising yields and weakening price trends are being repriced together.
Nasdaq and Nvidia Turned a Reassessment Into a Sell-Off
The Nasdaq fell 10% in the week ended November 20, 2026, its worst week since March 2020, according to CNBC. Nvidia dropped 14% on Friday and finished the same week down 23%; it was also down nearly 40% in November. Those moves made the semiconductor leader a direct transmission point from AI-specific anxiety into the broader technology market.
Anthropic supplied another test of investor appetite. The shares moved from their $83 IPO price to above $115 on Thursday, then closed the week at $88.91. That reversal matters because it showed that strong initial demand did not prevent rapid repricing once investors reconsidered the durability of AI growth.
The underlying growth comparison sharpened that concern. Anthropic recorded 47% revenue growth in the third quarter, down from 144% in the second quarter. Growth remained positive, but the change in pace gave investors a concrete metric against which to test expectations embedded across the AI complex.
The S&P 500 Lost a Closely Watched Trend Line
The S&P 500 broke below its 200-day moving average after trading under it on Tuesday and making a clearer break on Thursday. The 200-day moving average is a long-term price-trend measure; when the index falls through it, strategies that follow market direction may interpret the move as confirmation that momentum has weakened.
This mechanism can amplify an existing decline without explaining its original cause. Jeremy Siegel described accumulating pressures as “straws that break the camel’s back.” His observation fits the tape: weaker AI momentum, an index trend break, oil above $83 per barrel and a 10-year Treasury yield that had risen above 5% were all present, though the supplied evidence does not quantify each factor’s contribution.
The distinction is important. The market has already priced substantial damage into several AI-linked securities and major indexes. It has not established whether the adjustment is complete, whether economic activity will weaken, or whether the Federal Reserve will deliver any future rate decision now being discussed.
Federal Reserve Risk Pressures Equity Valuations
Oil remained above $83 per barrel while inflation was still away from the Federal Reserve’s 2% target. The central bank had increased rates by a quarter percentage point in September, and the 10-year Treasury yield subsequently rose above 5% before falling below that level on Friday.
Federal Reserve Governor Christopher Waller said a half-percentage-point increase might be needed next month. He told CNBC, “I’m very, very concerned about inflation,” adding that it was “headed in the wrong direction, and it’s spreading out.” This was a conditional policy warning, not confirmation of a future decision.
The market mechanism is straightforward: a higher Treasury yield raises the return available outside equities and can make future corporate earnings less valuable in present terms. That sensitivity is especially relevant when stock prices depend on expectations of sustained growth. A retreat in yields could reduce that pressure; renewed movement above 5% would keep the valuation test active.
AI Infrastructure Losses Showed the Breadth of the Reset
- Nvidia: The 14% Friday decline and 23% weekly loss placed the chipmaker at the center of the technology sell-off. Investors must now separate the company’s reported performance from the broader repricing of AI expectations.
- Anthropic: The close at $88.91 left the shares above the $83 IPO price but far below Thursday’s level above $115. The shift from 144% second-quarter revenue growth to 47% in the third quarter makes growth durability the relevant checkpoint.
- CoreWeave: The data-center builder, which uses high amounts of debt, was down 71% from its high. That relationship makes financing conditions particularly relevant when Treasury yields are elevated.
- Caterpillar: The company was down more than 50% from its high after being treated as an AI play through data-center construction and generators. Its decline shows that the reset had reached physical infrastructure exposure, not only software and semiconductors.
- VanEck Semiconductor ETF and iShares MSCI USA Momentum Factor ETF: Both were identified as AI momentum trades. Their inclusion indicates that weakness had moved through baskets and factor exposure as well as individual stocks.
What the Market Had Priced—and What It Had Not
The S&P 500 returned more than 20% in 2023, more than 20% in 2024 and gained 16% last year. Siegel contrasted that run with a long-period stock-market average of “8%, 9% a year up,” arguing that investors had begun treating 15 to 20% as a normal outcome in the AI era.
The current correction has challenged that expectation, though it has not erased every gain. The S&P 500 retained a 1% year-to-date advance. That creates a balanced setup: lower prices may represent a reset from unusually high return assumptions, while further weakness could reinforce pressure across wealth, sentiment and corporate expectations.
The evidence does not provide exact closing levels for the S&P 500, Dow Jones Industrial Average or Nasdaq Composite. It also does not establish future economic outcomes. Investors therefore have firm evidence of a technical and valuation reset, not proof of the correction’s eventual depth or duration.
Investor Checkpoints After the S&P 500 Break
- The 200-day moving average: Check whether the S&P 500 remains below this trend measure or recovers it. Continued trading below it could preserve pressure from momentum-sensitive strategies.
- The 10-year Treasury: Monitor whether its yield again moves above 5% or stays below that level. The direction will help indicate whether the rate burden on equity valuations is intensifying or easing.
- Federal Reserve communication: Test future statements against Waller’s conditional discussion of a half-percentage-point increase next month. No future rate decision is confirmed by the supplied evidence.
- AI growth metrics: Compare Anthropic’s next reported growth rate with the third quarter’s 47% and the second quarter’s 144%. For Nvidia, the next company update should be judged against the scale of its 23% weekly market loss, not assumed to validate either the bullish or bearish narrative.
The Next Test Is Rates Versus Growth
The constructive scenario is that the sell-off resets expectations after the S&P 500’s strong prior returns, Treasury yields remain below 5%, and AI companies provide evidence that growth can support their valuations. Under that condition, the correction could separate durable operating performance from momentum that depended on continuously rising prices.
The risk scenario combines renewed yield pressure with further deceleration in AI growth and an S&P 500 that cannot recover its 200-day moving average. The next decisive evidence will come from Federal Reserve communication, the direction of the 10-year Treasury yield, the index’s relationship with its long-term trend line and the next reported growth metrics from the AI complex.
📊 Analysis
Signal Bearish
Why Major indexes entered correction territory while sharp losses in Nvidia, CoreWeave and Caterpillar showed that pressure had spread across the AI trade.
This article was independently written by OneDayTrading from public reporting. Read the original (CNBC)