At a Glance
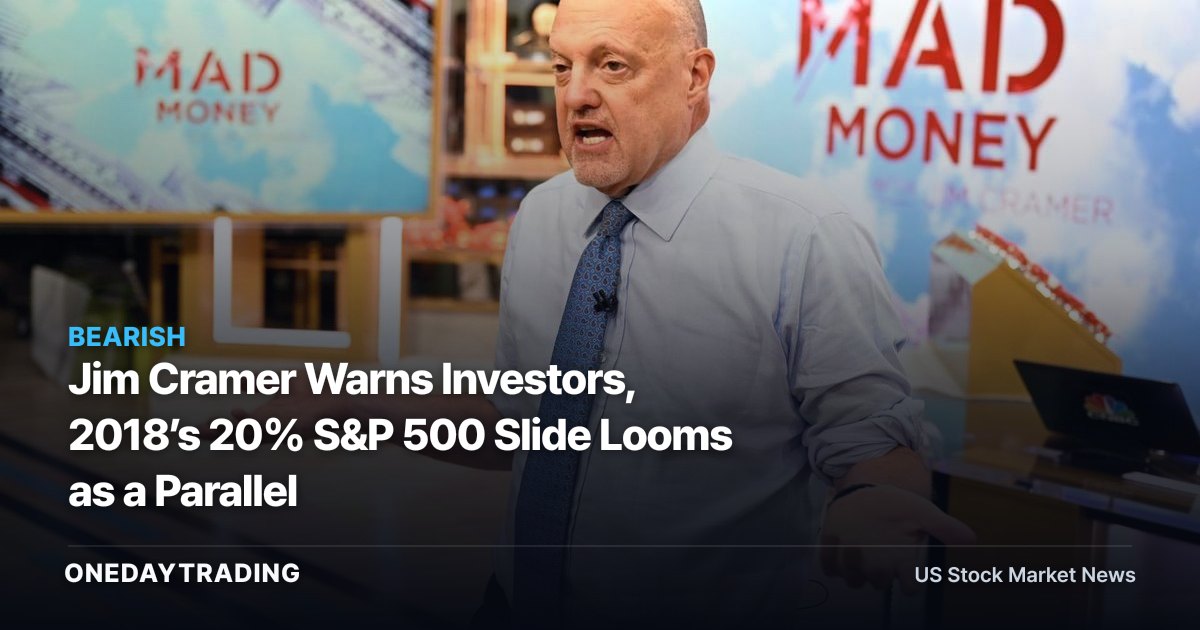
Jim Cramer warned investors on Sept. 11, 2026, that the current market shares troubling features with the fall of 2018, according to CNBC. His caution centers on the S&P 500 as rising oil prices, stubborn inflation and higher interest rates revive a historical comparison that argues for preparation rather than an indiscriminate exit.
According to CNBC, the S&P 500 fell roughly 20% from its late-September high through Christmas Eve in 2018. Cramer did not predict that the market would repeat that decline; he recommended trimming some winning positions and keeping cash available in case volatility creates weakness.
Why Cramer’s 2018 Market Comparison Matters Now
The 2018 comparison is a risk framework, not a forecast. According to CNBC, Cramer described rising oil prices, inflation above the Federal Reserve’s target and higher interest rates as warning signs for investors. Taken together, those conditions define the source of his caution without establishing whether stocks will fall, when volatility might arrive or how large any move could become.
The comparison carries weight because the historical drawdown was substantial and compressed into a specific period. According to CNBC, the S&P 500 lost roughly 20% from its late-September high through Christmas Eve in 2018. That record explains why Cramer sees the resemblance as relevant, but it does not prove that the present market will follow the same path.
Market volatility, in this context, means the possibility of larger or less predictable changes in stock prices. According to CNBC, Cramer’s response to that risk was measured: reduce part of some profitable positions, preserve cash and avoid treating the historical analogy as certainty. The distinction is important because preparation can address uncertainty without requiring a definitive call on the market’s direction.
Oil, Inflation and the 10-Year Treasury Yield Form the Warning
Oil provides the commodity component of Cramer’s warning. At the current moment, oil was near $100 per barrel, according to CNBC. Cramer included rising oil prices among the signs investors should monitor, alongside persistent inflation and higher interest rates.
The rates signal is equally explicit. At the current moment, the 10-year Treasury yield was approaching 5%, according to CNBC. Cramer linked the higher-rate setting with inflation remaining above the Federal Reserve’s target, making the outlook for monetary policy part of the market’s unresolved risk.
According to CNBC, the Federal Reserve’s next decision is not known. Whether it will raise interest rates remains uncertain, so the 10-year Treasury yield approaching 5% is a checkpoint rather than proof of a future policy action or stock-market outcome.
The Central Debate: Historical Rhyme or False Alarm?
- The bearish reading: According to CNBC, rising oil prices, stubborn inflation and higher interest rates resemble warning signs Cramer associates with the fall of 2018, when the S&P 500 subsequently suffered a roughly 20% decline from its late-September high through Christmas Eve.
- The limiting case: Cramer explicitly did not predict another 2018-style collapse, according to CNBC. Similar conditions do not establish that history will reproduce the same market path.
- The policy uncertainty: Whether the Federal Reserve will raise interest rates is unknown. According to CNBC, that uncertainty leaves investors without confirmation that the present setup will develop like the earlier episode.
- The portfolio question: According to CNBC, Cramer favored trimming some winners and maintaining cash rather than selling everything. His recommendation treats volatility as a possibility that merits flexibility, not as a predetermined crash.
Related Markets and Exposures
- S&P 500: This is the equity benchmark directly supported by CNBC’s historical comparison. The relevant reference point is its roughly 20% fall from the late-September high through Christmas Eve in 2018.
- Oil: At the current moment, oil was near $100 per barrel, according to CNBC. Cramer identified rising oil prices as one part of the warning configuration facing investors.
- 10-year Treasury yield: At the current moment, the 10-year Treasury yield was approaching 5%, according to CNBC. Its level makes interest rates a central part of the comparison with fall 2018.
- Federal Reserve policy: According to CNBC, inflation remained above the Federal Reserve’s target. A future interest-rate increase is possible but unconfirmed, so policy remains a live uncertainty rather than an established result.
What Investors Should Watch
- Oil relative to the reported level: Use oil near $100 per barrel at the current moment, as reported by CNBC, as the stated reference point. A change from that level would alter one component of Cramer’s comparison, although the fact sheet establishes no specific market outcome from such a change.
- The 10-year Treasury yield: Monitor whether the yield continues toward, reaches or moves away from the 5% level it was approaching at the current moment, according to CNBC. The supplied facts do not establish which direction will follow.
- Federal Reserve action: The concrete confirmation point is an actual interest-rate decision. Whether the Federal Reserve will raise rates is unknown, and no decision date is supplied.
- Portfolio liquidity: According to CNBC, Cramer recommended trimming some winning positions and retaining cash. That approach can be assessed against actual volatility if it emerges, though its timing and magnitude are unknown.
Overall Outlook
The evidence supports caution, not capitulation. According to CNBC, oil near $100 per barrel at the current moment, a 10-year Treasury yield approaching 5% at the current moment and inflation above the Federal Reserve’s target created the warning Cramer compared with fall 2018. The roughly 20% S&P 500 decline from its late-September high through Christmas Eve in 2018 shows why investors may take that comparison seriously.
The counterweight is just as clear: Cramer did not forecast another collapse. According to CNBC, he said investors should not sell everything simply because history might repeat, and he advised trimming winners and keeping cash available instead. That positioning reflects an uncertain distribution of outcomes rather than a single bearish destination.
The next meaningful evidence will come from the variables already inside the warning: oil, the 10-year Treasury yield, inflation relative to the Federal Reserve’s target and an eventual Federal Reserve rate decision. Until those signals clarify, the disciplined reading is that 2018 offers a stress test for portfolios—not a confirmed map of what happens next.
📊 Analysis
Signal Bearish
Why Cramer identified rising oil prices, persistent inflation and higher interest rates as warning signs, while stopping short of forecasting another collapse.
This article was independently written by OneDayTrading from public reporting. Read the original (CNBC)