
Three-Line Briefing
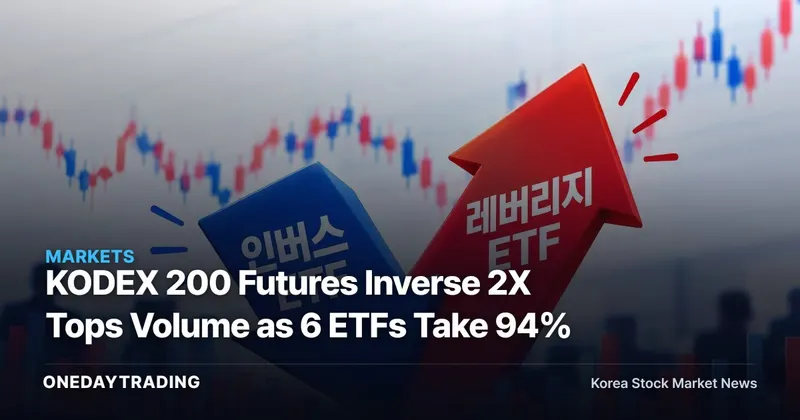
- According to Korea Exchange (KRX) data cited by Maeil Business Newspaper’s securities desk, six of the 10 most actively traded domestic ETFs from the start of the year through the 23rd of this month were inverse or leveraged products. The real takeaway is not whether the market rose or fell, but how heavily trading was concentrated in directional products.
- Those six products accounted for 94% of total ETF trading volume over the same period. By trading volume distribution, activity in Korea’s ETF market was heavily concentrated in a small number of products.
- KODEX 200 Futures Inverse 2X ranked first in trading volume with 1.3121 trillion units traded year to date. Because the data do not include returns or the scale of losses, the success of these trades cannot be assessed.
What KODEX 200 Futures Inverse 2X’s No. 1 Ranking Means
KODEX 200 Futures Inverse 2X is designed to deliver twice the inverse of the daily return of the KOSPI 200 Futures Index. Commonly known in Korea as a “double inverse” ETF, it takes a bearish position while magnifying the index’s daily move by a factor of two. The 1.3121 trillion units traded so far this year do not validate any particular market forecast; they show that this structure was used for trading more frequently than any other ETF.
It is important to distinguish what the data confirm from what they do not. While the fund’s No. 1 ranking by trading volume is established, no figures were provided for trading value, trading shares by investor type, returns or losses. It would therefore go beyond the evidence to infer from this figure who invested how much in which direction or how those trades performed.
KODEX Inverse and TIGER 200 Futures Inverse 2X Also Rank High
KODEX Inverse ranked second in trading volume, with 126.8 billion units traded from the start of the year through the 23rd of this month. The product tracks the inverse of the daily return of the KOSPI 200 Futures Index. Although both products take bearish positions, only one provides double inverse exposure, so its structure should be distinguished from that of KODEX 200 Futures Inverse 2X.
TIGER 200 Futures Inverse 2X ranked third with 18 billion units traded over the same period. KODEX KOSDAQ 150 Futures Inverse ranked sixth and is designed to benefit from declines in the KOSDAQ 150 Index. The data confirm that the most actively traded inverse products span both the KOSPI 200 Futures Index and the KOSDAQ 150 Index, but they do not provide a basis for quantifying the scale of bearish expectations.
Leveraged Products Rank Fourth and Fifth
Trading was not confined to bearish products. KODEX Secondary Battery Industry Leverage ranked fourth in trading volume from the start of the year through the 23rd of this month, while KODEX KOSDAQ 150 Leverage ranked fifth. The presence of both inverse and leveraged products near the top supports the view that trading was concentrated across products taking different directional positions, rather than reflecting a single market direction.
The prominence of inverse products may stand out at first glance, but leveraged products were also well represented. The six products’ 94% share should therefore not be interpreted immediately as a purely bearish signal. Investors should first examine which directional products tracking particular indexes and industry sectors attracted the highest turnover. Trading volume is clear, but the resulting gains and losses fall outside the scope of the available data.
Three Points to Watch in the Next ETF Data Release
- If the concentration persists, the next release should first be checked for how many inverse and leveraged products remain among the 10 leading ETFs by trading volume and what share they represent of total ETF trading volume.
- If KODEX 200 Futures Inverse 2X retains the top spot by trading volume, it would indicate that trading remains concentrated in a product providing twice the inverse daily return of the KOSPI 200 Futures Index. A change in the rankings would signal a shift in where that concentration lies.
- The key question is whether the next data release provides trading value, trading shares by investor type, and returns and losses by product alongside trading volume. Those figures are needed to assess the scale and performance of trading separately.
- The current data support only the conclusion that trading was concentrated in directional ETFs. They should not be stretched into a definitive signal that the market will rise or fall.
This article was automatically summarized and analyzed from the original news report. View the original article (Maeil Business Newspaper Securities)