
What Hana Securities’ Race for the No. 3 Market-Cap Spot Means
The Hana Securities report covered by the Seoul Economic Daily on the 25th, the financial investment industry’s reference date, is about more than a simple market capitalization ranking. It suggests that even as Samsung Electronics and SK hynix drive the KOSPI higher, the basis for investment decisions could shift from the absolute level of earnings to the pace of improvement and valuation rerating. The first-half candidates for next year are LG Energy Solution and Samsung Electro-Mechanics, while Samsung Biologics and Hyundai Motor are the leading second-half candidates.
The candidates for the No. 3 market-cap position are not companies certain to overturn the current rankings. Rather, they are companies identified as potential next market leaders if accelerating earnings growth coincides with a rerating. One point investors should remember is that “after semiconductors” does not mean semiconductors will retreat. The outlook instead maps out a sequence in which investor attention broadens to non-semiconductor companies while the semiconductor rally retains momentum.
Why 33% Matters More Than the KOSPI’s 1,053 Trillion Won
Under Hana Securities’ forecast, the net profit of KOSPI-listed companies will reach 1,053 trillion won next year, exceeding this year’s estimated 794 trillion won. While absolute earnings will increase, the growth rate is projected to slow from 265% this year to 33% next year. The real message is not a change in the direction of earnings, but a change in their pace.
As market-wide earnings growth slows, the key differentiator among stocks (tickers) will increasingly be which companies can improve fastest. There is also evidence that high earnings alone may not explain share-price rerating. Since 2010, the correlation coefficient between forecast KOSPI net profit and the price-to-earnings ratio has been -0.5, moving in the opposite direction from the S&P 500’s 0.7.
Why the First-Half Numbers Differ for LG Energy Solution and Samsung Electro-Mechanics
LG Energy Solution is projected to swing from a net loss of 242.1 billion won this year to a net profit of 1.9877 trillion won next year. The investment case rests on this earnings turnaround from loss to profit. If net profit recovers as forecast next year, it could support a market capitalization rerating, although an actual rise in the rankings remains unconfirmed.
Samsung Electro-Mechanics’ net profit is projected to increase from 1.6233 trillion won this year to 3.2454 trillion won next year. While LG Energy Solution is being assessed on the scale of its earnings turnaround, Samsung Electro-Mechanics offers a path of expanding earnings from an already profitable base. Despite both being first-half candidates, the market will need to test different aspects of their respective cases.
Rerating Is Key for Samsung Biologics and Hyundai Motor
No specific net profit forecasts were provided for the leading second-half candidates, Samsung Biologics and Hyundai Motor. The confirmed factors are earnings growth and relative share-price underperformance at Samsung Biologics, along with an expected improvement in return on equity and a relatively low price-to-book ratio at Hyundai Motor. Their investment cases therefore center more on valuation rerating than on a sharp change in earnings.
Lee Jae-man, an analyst at Hana Securities, said, “Even if semiconductor-led earnings growth continues, investors should watch for the possibility that non-semiconductor companies capable of improving earnings growth and securing a valuation rerating could emerge as the new No. 3 company by market capitalization.” More information on the basis and detailed assumptions behind each forecast would be needed to conclude that any company will actually take the No. 3 spot.
Samsung Electronics and SK hynix Are Expected to Move First
Hana Securities expects Samsung Electronics and SK hynix to lead the KOSPI higher from late this year through the first quarter of next year. Samsung Electronics closed at 213,500 won on the 23rd, 41.1% below this year’s high of 362,500 won. The report also noted that in the five instances since 2000 when the stock fell at least 40% from a peak, it subsequently gained a cumulative average of 40.1% over five months.
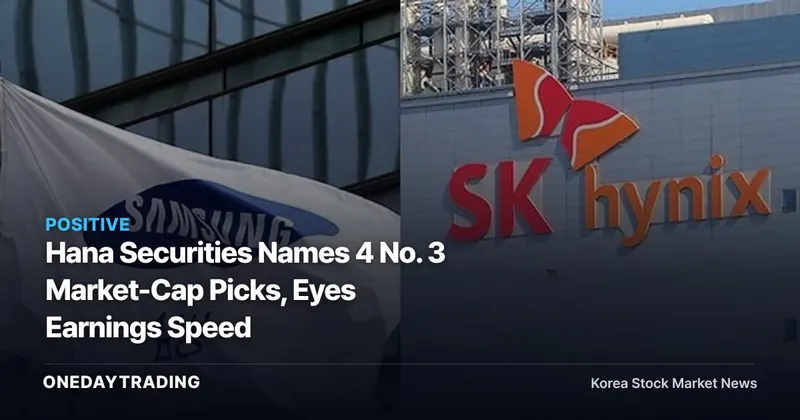
The scale of earnings also reinforces the semiconductor sector’s prominence. Hana Securities projects next year’s operating profit at 561 trillion won for Samsung Electronics and 404 trillion won for SK hynix, compared with a forecast of 616 trillion won for Nvidia. The emergence of non-semiconductor candidates is less an argument that semiconductor earnings will weaken than a recognition that strong semiconductor earnings alone cannot explain every market rerating.
Conditions to Check When Assessing the No. 3 Market-Cap Candidates
- LG Energy Solution: The first test at the next earnings release will be whether this year’s net loss of 242.1 billion won is moving toward the forecast net profit of 1.9877 trillion won next year.
- Samsung Electro-Mechanics: If the forecast of 3.2454 trillion won in net profit next year holds, the case for its first-half candidacy will strengthen. If the forecast declines, the earnings-growth basis for a rerating will also weaken.
- Samsung Biologics and Hyundai Motor: Their next earnings releases should be checked to determine whether earnings growth and improved return on equity materialize in the reported figures.
- Leadership duration: Earnings improvement and expansion phases in non-semiconductor industry sectors last an average of five months, shorter than the semiconductor sector’s eight-month average. Selection as a candidate should not be treated as equivalent to becoming a long-term market leader.
From Semiconductor Dominance to Sequential Expansion
In the bullish scenario, Samsung Electronics and SK hynix drive the index from late this year through the first quarter of next year, after which rerating broadens to non-semiconductor companies with confirmed earnings improvements. In that case, earnings turnarounds and expansion would provide the momentum in the first half, while valuation rerating would take over as a distinct driver in the second half.
The bearish scenario would be triggered if the candidate companies’ earnings forecasts fail to materialize in their actual results. Given the relatively short average expansion phase for non-semiconductor companies, it would be more prudent to assess the direction and pace of earnings at the next earnings release before focusing on ranking forecasts. The market has already priced in the earnings scale of major semiconductor companies, while the four candidates’ actual ascent to the No. 3 market-cap position remains unproven.
LG Energy Solution Key MetricsAs of 2026-10-26
| Period Return | 1 Week -12.73% 1 Month +7.10% |
|---|---|
| Trading Value · Trading Volume | 8.5 billion won · 98,738 shares |
| Supply-Demand (Order Flow) | Foreign Investors Net selling of 900 million won Institutional Investors Net selling of 400 million won |
Price and supply-demand (order flow) data are real-time figures from Korea Investment & Securities (KIS), while supply-demand (order flow) and news-tone assessments are calculated independently by One Day Trading.
Supply-Demand (Order Flow) and Momentum Assessment🔴 Caution
Foreign investors, institutional investors and momentum indicators are showing negative signals.
- ▼Dual SellingForeign investors sold a net 900 million won · Institutional investors sold a net 400 million won
Upcoming Dates to Watch
- 10.28FOMC Policy Rate DecisionHighU.S. Federal Reserve monetary policy announcement — direction of interest rates and the dollar
- 11.12Index Options ExpirationLowKOSPI 200 options expiration
- 11.26Bank of Korea Monetary Policy BoardHighBenchmark interest rate decision meeting
- 12.09FOMC Policy Rate DecisionHighU.S. Federal Reserve monetary policy announcement — direction of interest rates and the dollar
This article was automatically summarized and analyzed based on the original news report. View Original Article (Seoul Economic Daily)